The Market: Beware of "Oversold" Conditions
Don't lose sight of the historic set-up unfolding: overvaluation, excessive VOL selling speculation, spectacularly hawkish monetary policy, and lose-lose economy vs. bond market relationship.
Discussion
As I’ve been documenting via Xwitter since yesterday, relying on “oversold” conditions (i.e. technical analysis) in a market environment where fundamentals have taken over is fraught with danger.
The vast majority of the time technical analysis works: SPX moves down to the 50dma and snaps back; sentiment becomes oversold and SPX snaps back; the % of stocks above their 50dma moves down below 50% and SPX snaps back. But the “vast majority” portion of the statement matters.
When fundamentals take over, technicals fail spectacularly.
The immediate pushback to this will be the probabilities associated with “oversold” technical analysis. Yes, on average over time, when particular indicators become particularly “oversold”, there is an 80%+ probability of above-average market returns looking out 1-12 months. It’s in the 20% bucket that fundamentals take over, but because that bucket is so small, the odds are obviously against those who espouse fundamentals over technicals.
This is why I prefer a “weight of the evidence” approach that can flexibly and dynamically weight the key building blocks of market returns: the economy, the Fed, and the “tape” (see the June 14 post for more detail on my process). Investing and trading are highly personal endeavors, and everyone needs to develop a process that “fits their eye” - this WOTE approach fits mine, allowing me to add what I believe to be very valuable fundamental context to technical analysis at key turning points.
We are at such a turning point.
The Fundamental WOTE
Valuation rarely matters, but when it does it matters “bigly”. As discussed on August 3, with TIPS 30s trading at 197 bps SPX fair value was around 2600 assuming a 4% “fair value equity risk premium”. TIPS 30s are now 10 bps higher, adding to the downward pressure.
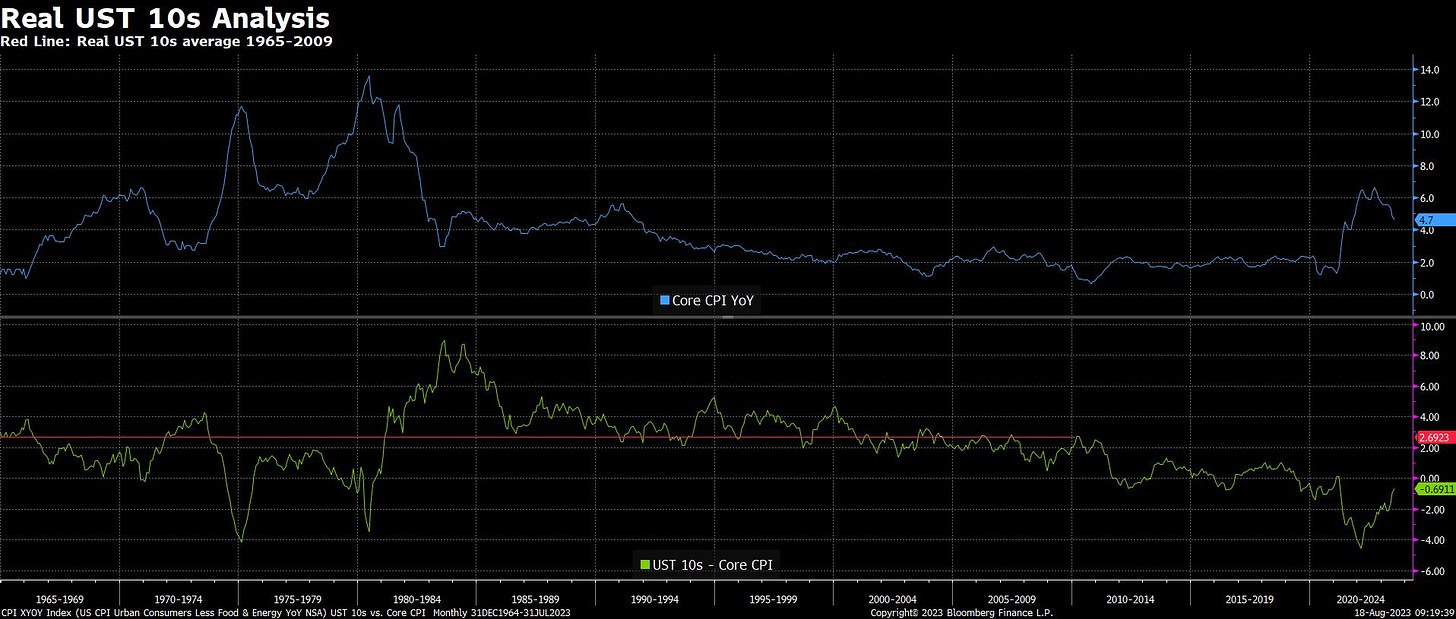
This valuation gap matters today because it puts SPX in a no-win situation vis-a-vis the economy. If the economy reaccelerates and Core CPI sticks at 3-4%, history suggests UST 10s should trade 250 bps higher on average1, or 550-650; and if a recession hits, because the UST curve is already inverted long rates are unlikely to materially cushion the recessionary blow to earnings and valuation compression.
The Fed. Below is the first post on The WOTE, and it is just as relevant today if not more so.
The bottom line: We are likely to look back on this market set-up in awe, a truly historic combination of overvaluation, excessive VOL selling speculation, spectacularly hawkish monetary policy, and lose-lose economy vs. bond market relationship.
1987 vs. 2020
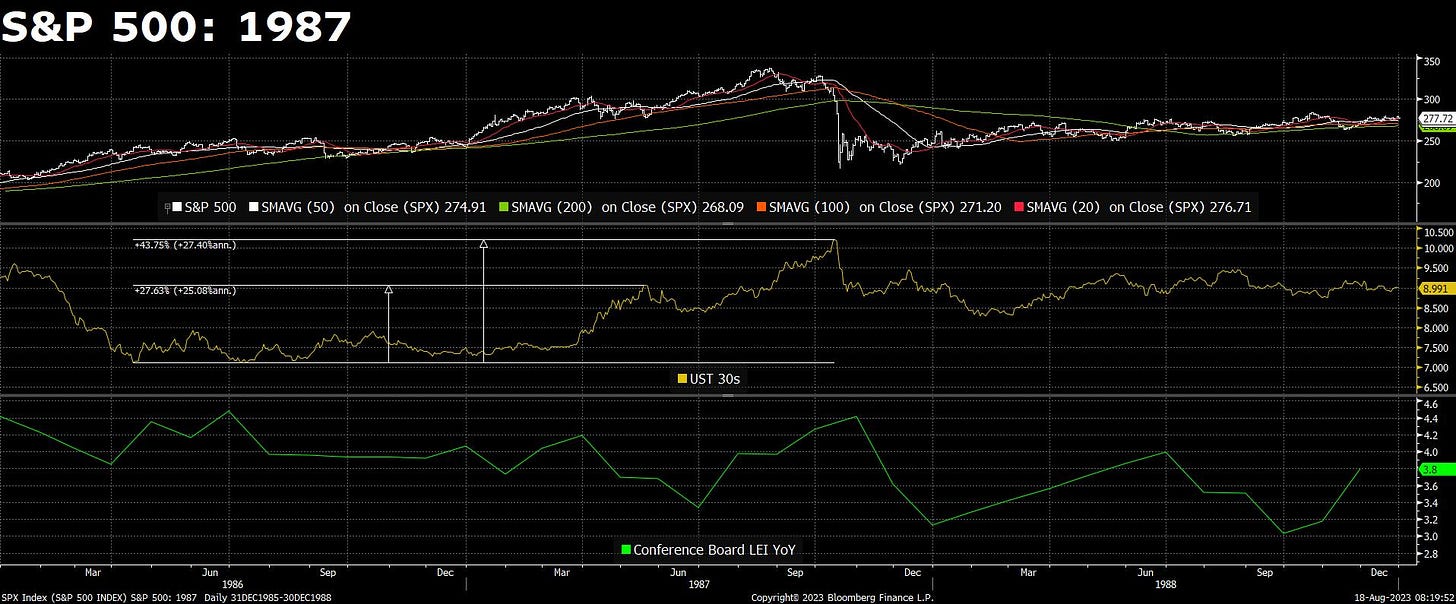
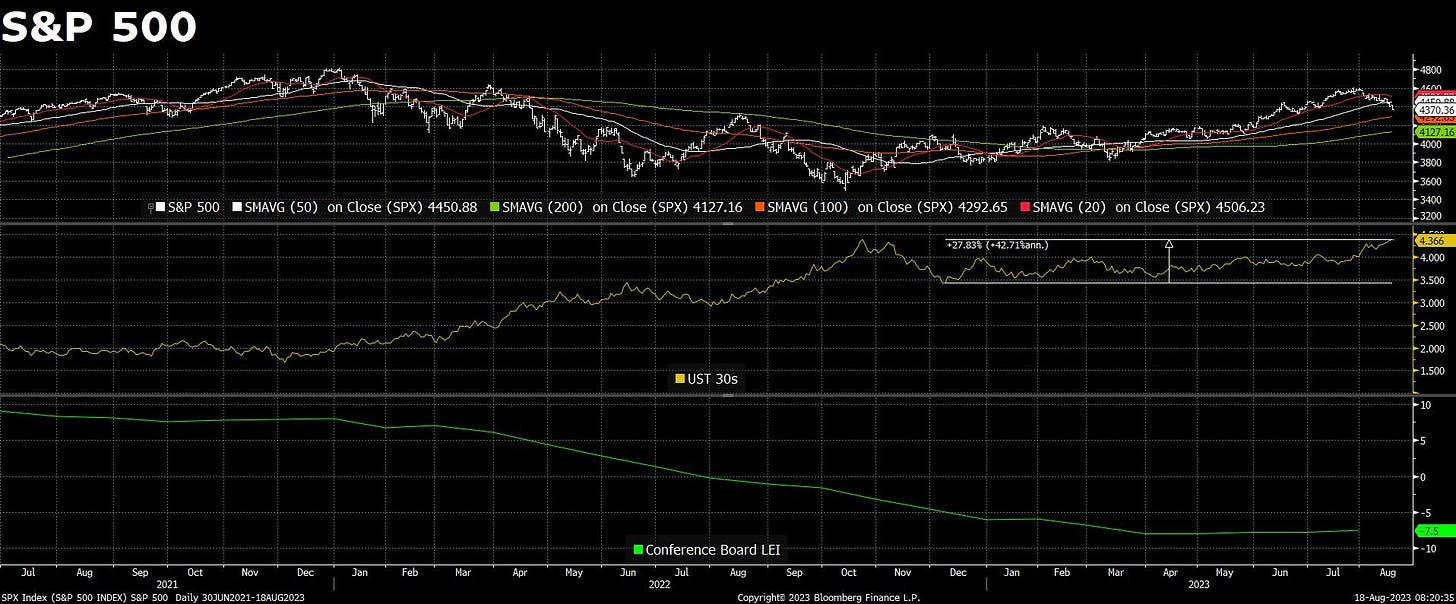
As discussed on August 3, the lead-up to the 1987 crash is a useful analog for considering how SPX can trade in a period of rapidly rising rates. In 1987 it took a lot to finally crack the market. UST 30s ripped 27% off the lows and SPX corrected down to its 100dma, but SPX found its footing and went onto make new rally highs even with 30s continuing to rise. It wasn’t until 30s were up around 44% that SPX finally cracked. It just so happens that today UST 30s are up 28% from their December 2022 lows. As such, if the 1987 analog is to hold, it would not be a surprise if SPX found its footing around the 100dma of 4293 (at last close).
The problem with the 1987 analog is the macro backdrop is more precarious, as illustrated by the deeply negative Conference Board LEI today versus the solidly positive reading in 1987.
Holding two opposing thoughts on one’s head is obviously difficult, but it’s very necessary here. With the weight of the macro/market evidence so decidedly negative (as discussed above) and the market exiting the supportive window of options expiration (we look forward to Cem Karsan’s update this afternoon) right into the seasonally dangerous period of September/October,
the COVID correction period MUST be considered when contextualizing “oversold” conditions.
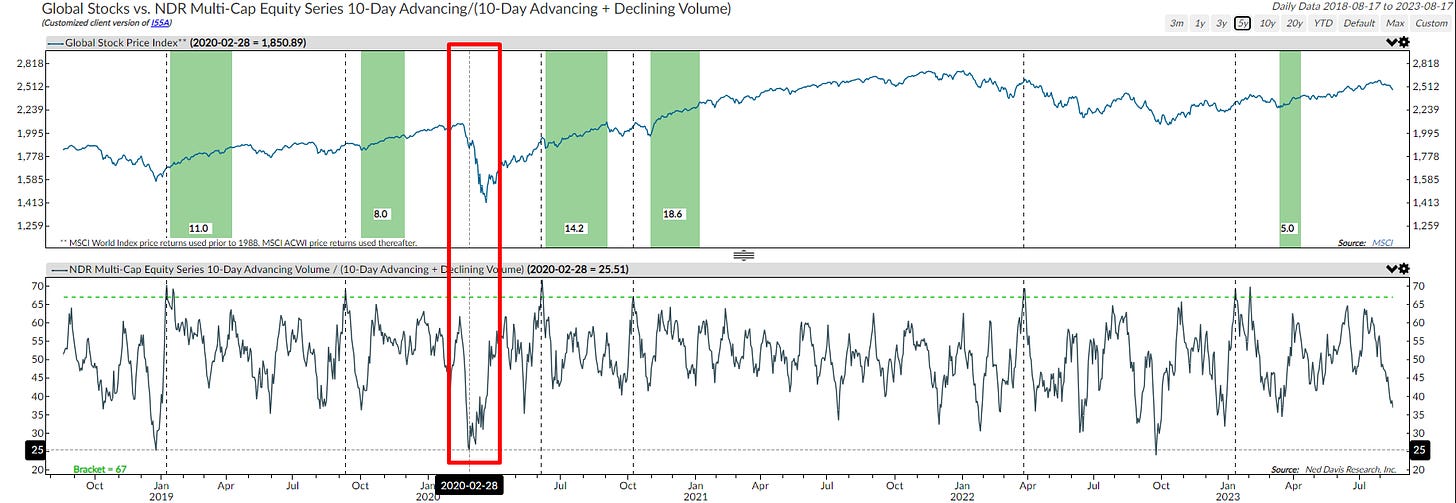
In early March 2020 two key technical indicators became extremely oversold: the S&P 500 Daily Sentiment Index and declining volume as a % of total volume. SPX bounced from these conditions, but very briefly before the bulk of the correction was realized.
Not only are these two indicators not even extremely oversold yet, we need to keep firmly in mind that even if they do reach extremely oversold levels that the decline may just be getting started.


