

The Market: Back to Basics
The Market: Back to Basics
Tight monetary policy in/into recession with equity market breadth quickly deteriorating says the bear market remains firmly intact. Downside should commence once the "short" squeeze concludes.

The Framework
The WOTE’s framework for determining the primary trend in place for the stocks looking out 6-18 months is comprised of three pillars:
The Economy
The Fed
The Tape
The Economy. The economy is very rarely in recession, and since outside of recession corporate profits tend to expand in line with economic growth, stocks have a strong tendency to rise when the economy is outside of recession. A growing economy acts as a floor under the market, so even if the Fed is tightening policy or the “tape” is weak, outside of recession the market tends to fall no more than -20% and bounce back quickly when it does.
Stocks tend to decline the most in and around recessions, as recessions produce a contraction in corporate profitability. For reference, in the 7 NBER-defined recessions since 1969 (excluding 2020), the S&P 500 has fallen by an average of -36%.
So, the economy matters, but mostly at very specific points in time.
The Fed. The oft-cited maxim “don’t fight the Fed” is actually a bit of a misnomer. Because the Fed tries to smooth out the business cycle, it tends to tighten monetary policy when the economy is strong and ease policy when it’s weak. As such, it pays to “fight the Fed” early in both tightening and easing cycles.
The Tape. The highest level analysis of the “tape” - i.e. the direction of the equity market - is to assess both the level of the index versus a longer-term moving average such as the 200-day moving average, and the direction of said moving average. Over time, when an index such as the S&P 500 is trading above its 200dma it’s generally good practice to simply buy and hold, especially if the 200dma is rising; and if the index happens to fall below the 200dma, as long as the economy is likely to avoid recession it pays to continue holding and/or buy the dip.
The next level of “tape” analysis is to assess the underlying health of the trend. Toward the end of a rally there tends to be a deterioration in the number of stocks participating in the uptrend; and likewise, toward the end of a decline there tends to be a deterioration in the number of stocks participating in the downtrend.
Then third final level is sentiment and positioning. In both uptrends and downtrends, if the trend goes for long enough in one direction sentiment and positioning can become so one-sided that the market will move in a “counter-trend” manner for a period of time.
Let’s now look at where we currently stand.
The Outlook
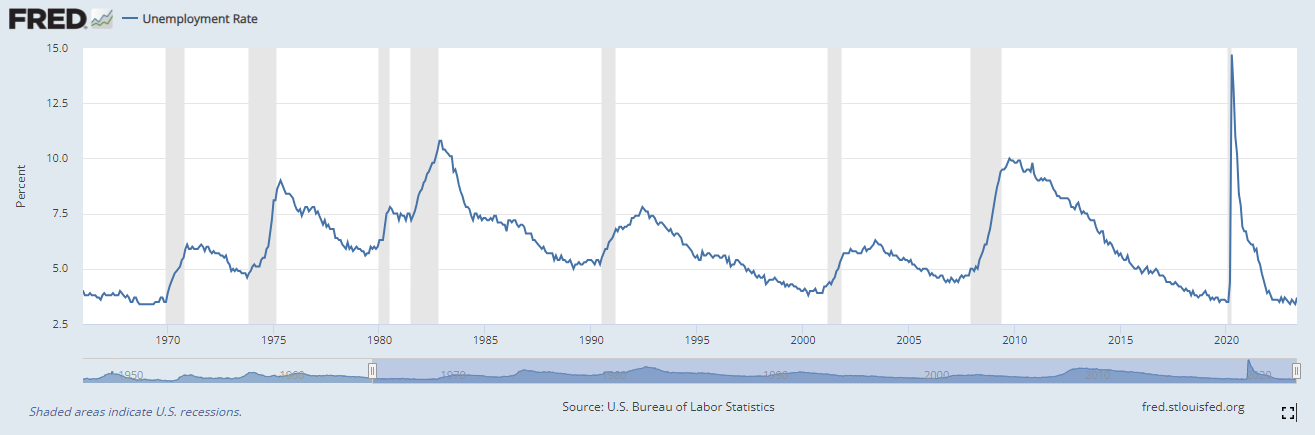
The Economy. Far and away the biggest debate in the market right now is the state of the US economy. With the Federal Reserve openly and actively seeking to raise the unemployment rate to bring inflation back to its 2% target and ensure it remains there over time, naturally, market participants and financial market observers are on high alert for a recession. The upshot of the Fed’s focus on raising the unemployment rate is that market participants continue to conclude that a recession is not yet here, or even unlikely, due to the fact the unemployment rate has barely budged despite the Fed raising the Federal Funds Rate by 500 basis points in just over a year. Because the unemployment rate lags the business cycle, particularly in a high inflation regime such as today, it is The WOTE’s opinion that market consensus is inappropriately dismissive of recession risk. More on this in a bit.
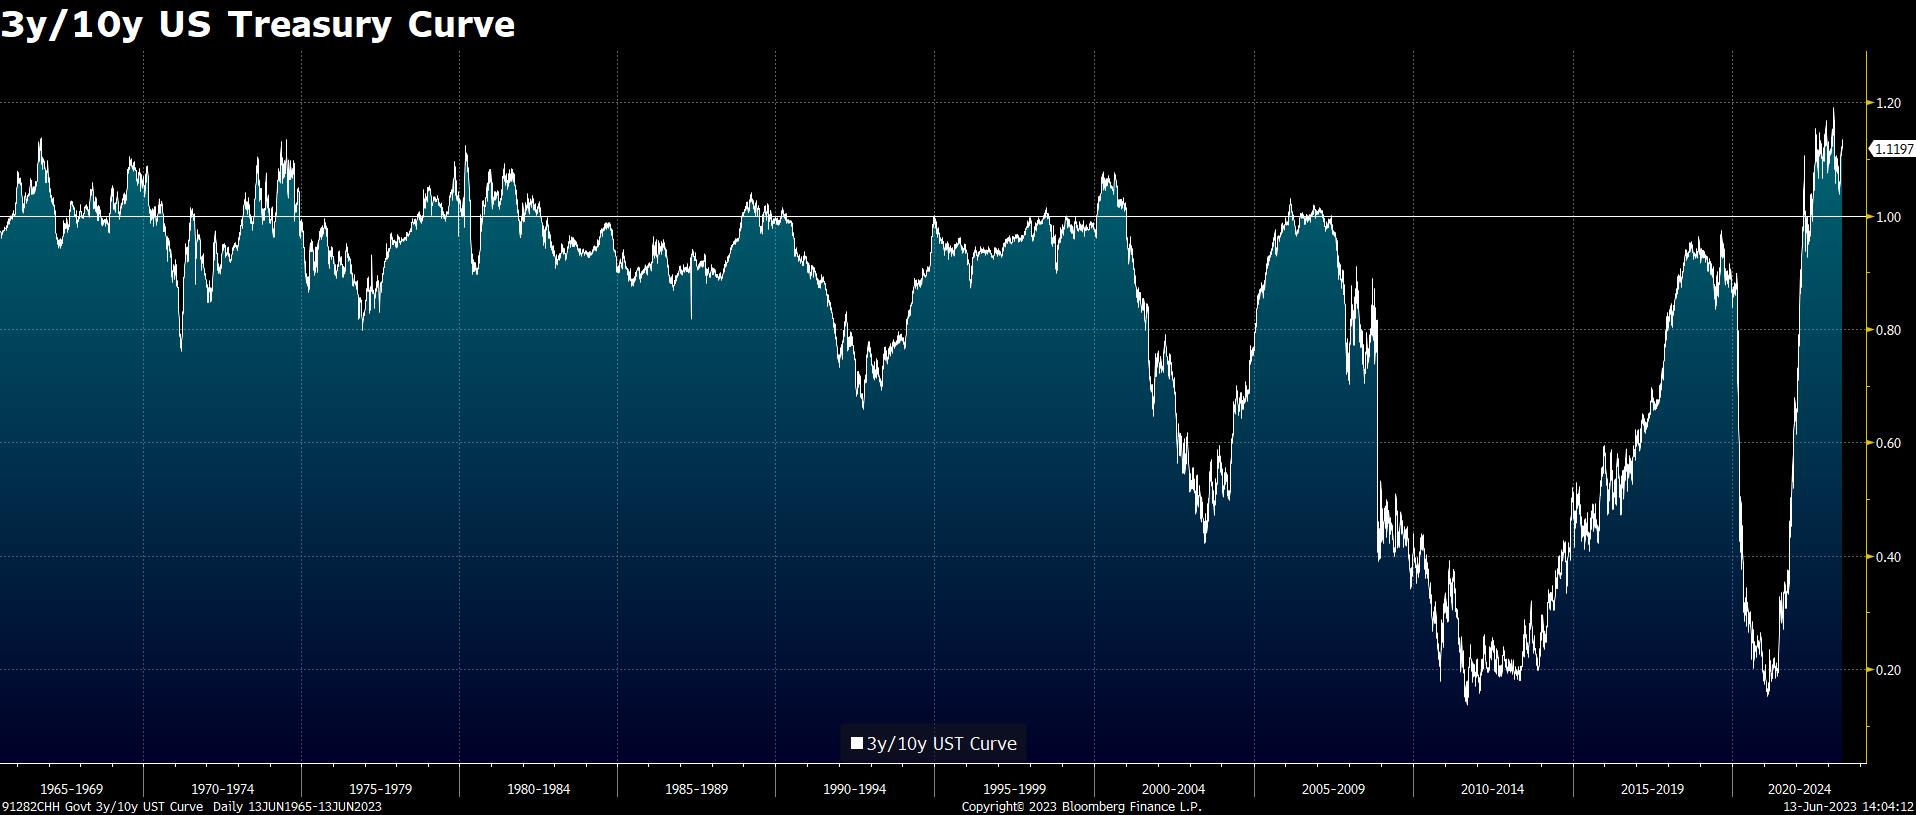
The Fed. Zooming out from the daily market obsession with Fed speakers and FOMC meetings, monetary policy is objectively tight based on the current position of the 3y/10y US Treasury curve. In short, when the 3-year Note yield is above the 10-year Note yield policy is tight; and when it is well above the 10-year for an extended period of time, as it has been since last July, policy is very tight.
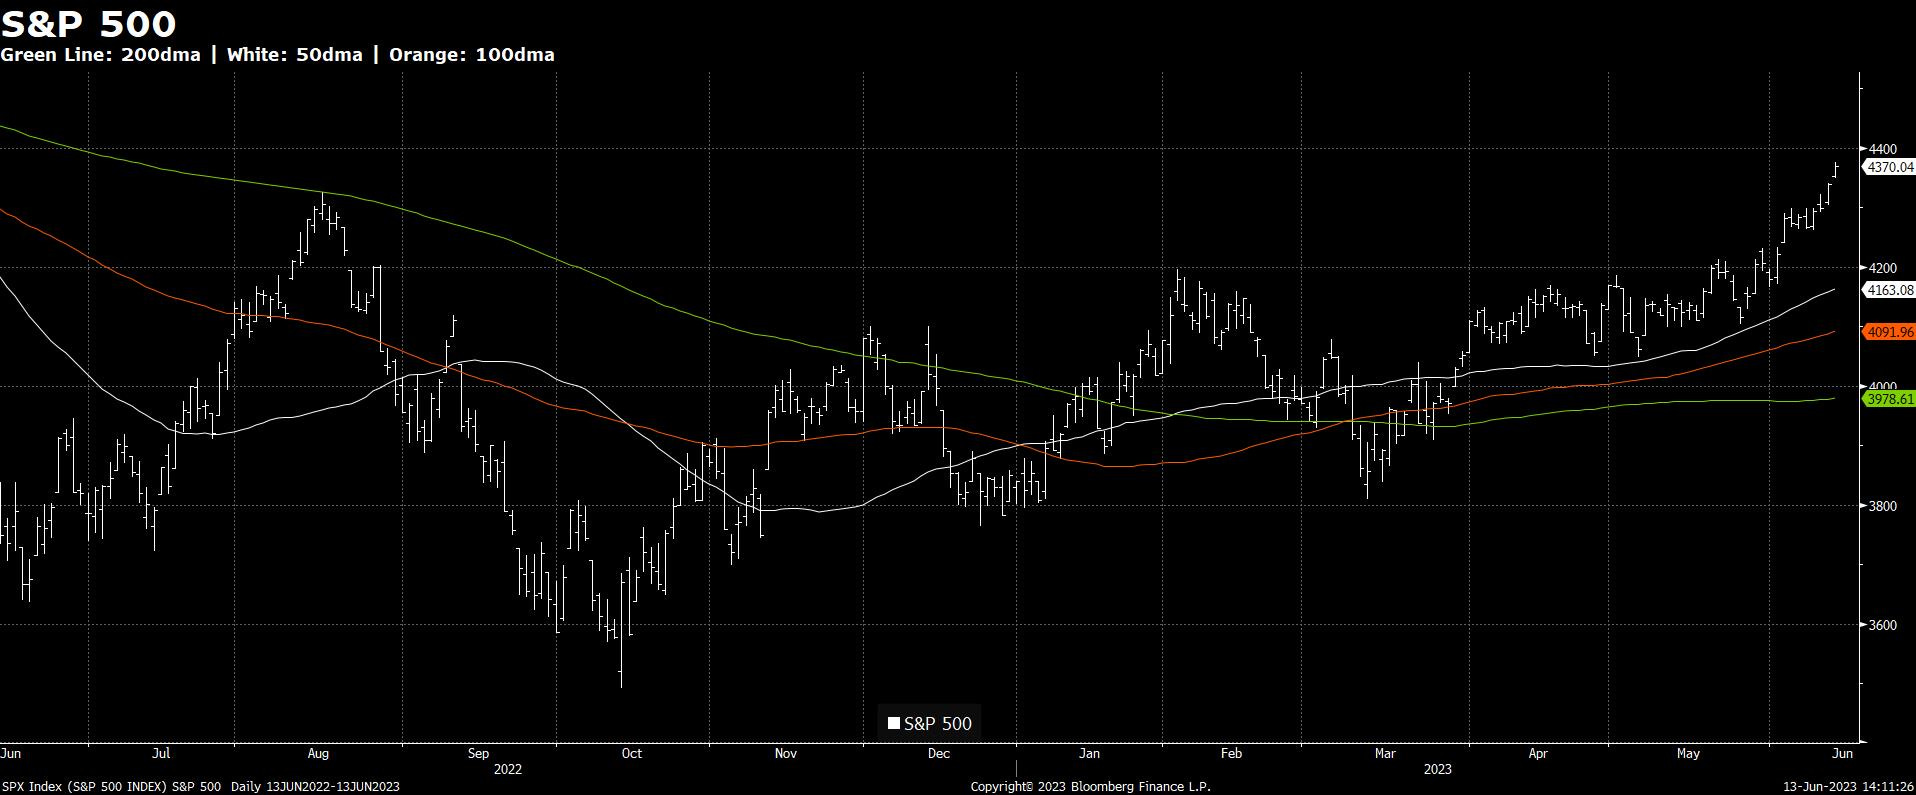
The Tape. At the highest level of “tape” analysis, the S&P 500 is currently in a strong uptrend: it’s trading above its 200dma, the 200dma is beginning to tick higher, and the 50dma and 100dma lines are above the 200dma. That’s bullish, no two ways about it.
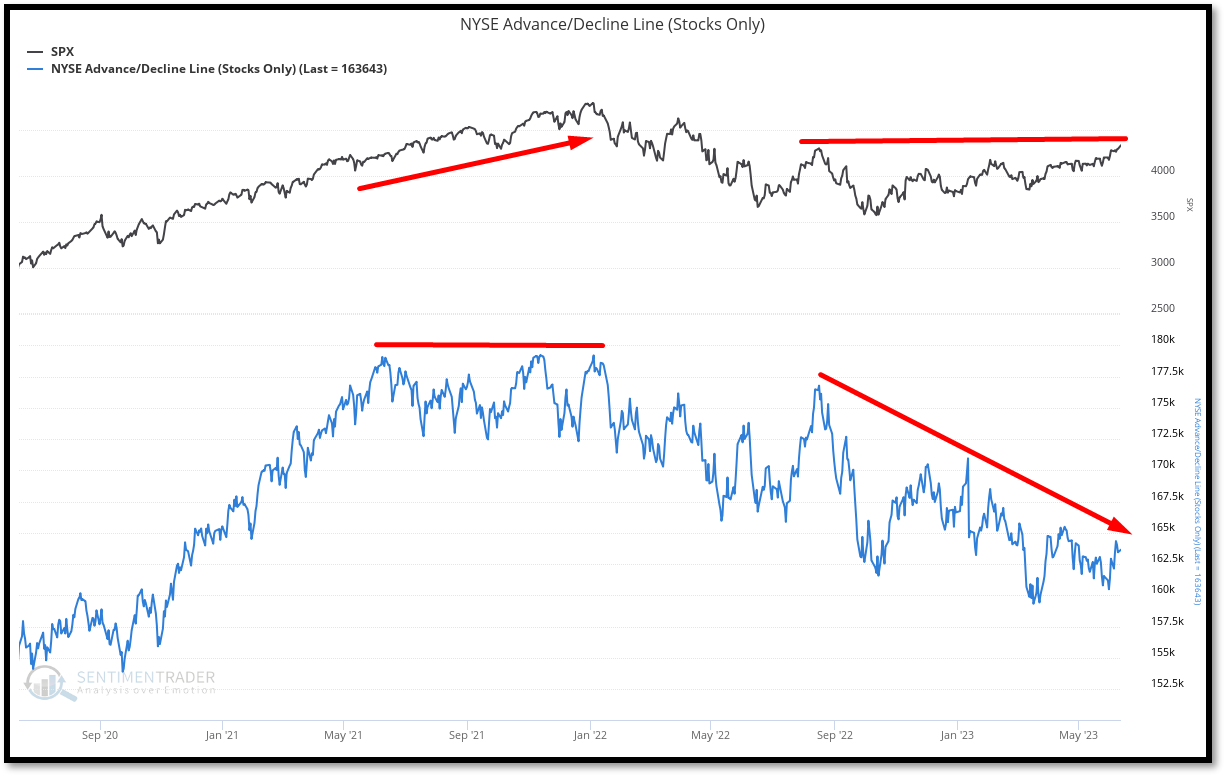
But at the second level it’s not a pretty picture. Underlying participation in the uptrend has deteriorated substantially, making a series of “lower highs” while the S&P 500 has made a series of “higher highs”.
The third level of analysis is where The WOTE has erred most significantly since the end of 2022. Because the Fed has been so open about its intentions to weaken the economy, market participants built up a large aggregate “short” position against equities in anticipation of the customary -36% decline in the S&P 500 in and around recessions, and as that anticipated recession has been pushed back - as measured by a material rise in the unemployment rate - participants have closed out this “short” positions, underpinning a rise in the S&P 500 YTD.
Unfortunately, The WOTE did not become intimately familiar with the process of Cem Karsan until recently, but Karsan is one of if not the best observer of market positioning around. This recent “short squeeze” in the S&P 500 is precisely what Karsan has been looking for to clear out “short” positioning and set the stage for a more substantial move lower. We are close, if not there already.
Adding it all up, we have tight monetary policy in place as the economy heads into recession, if it’s not in one already; and beneath the bullish surface of an S&P 500 trading above its rising 200-day moving average, participation is deteriorating in pretty dramatic fashion. Perhaps there are more “shorts” to squeeze as Cem Karsan has been anticipating, but as soon as that squeeze is over the downside should open up quite quickly.
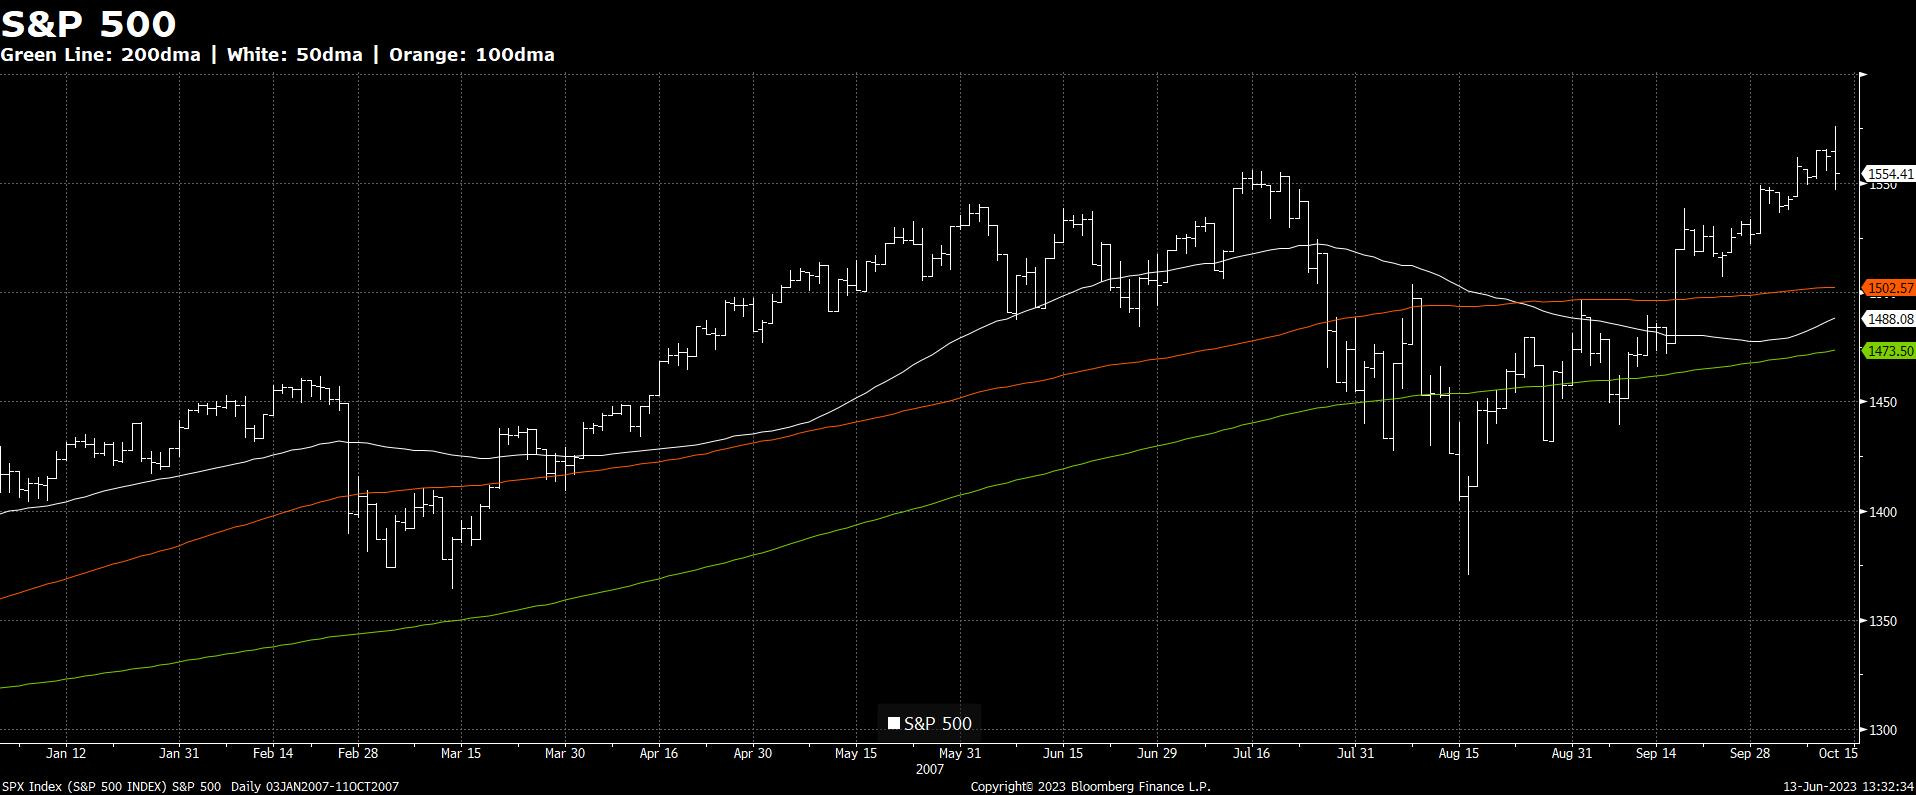
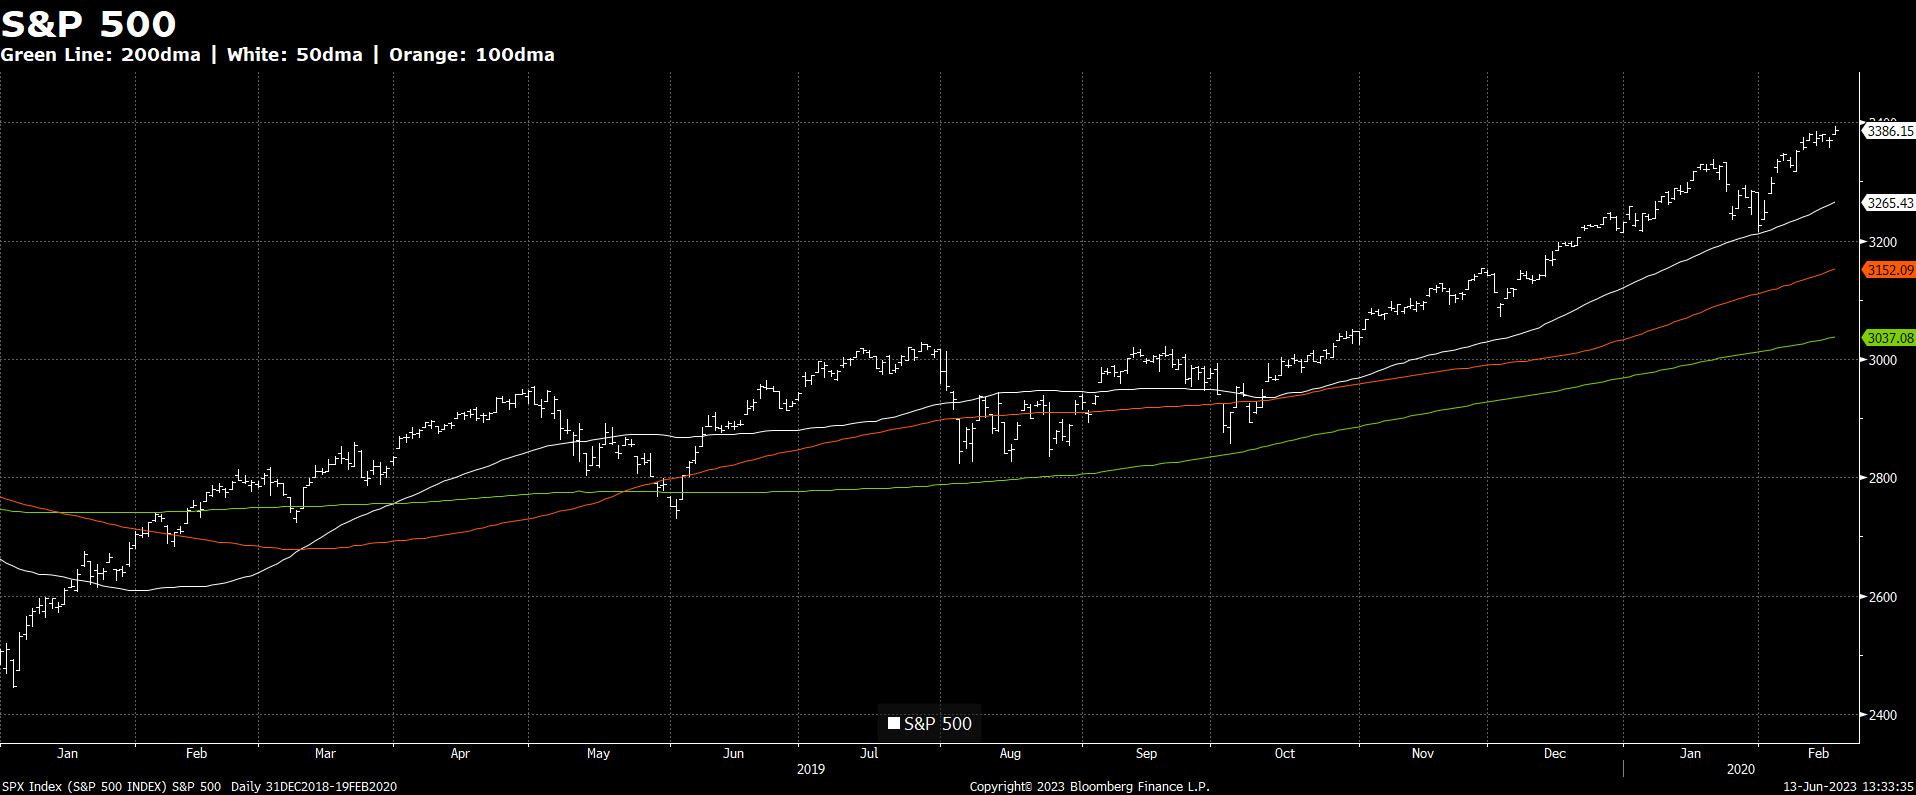
Equity market bulls will push back against this analysis on a variety of fronts, but perhaps most forcefully on the “don’t fight the tape” front with the S&P 500 trading above a 200dma that is just beginning to rise. However, in light of the above configuration of tight monetary policy into/in recession with deteriorating “tape” health, The WOTE believes it is worth considering how the S&P 500 looked on the surface as it peaked in 2000, 2007 and 2020 just prior to large-scale declines.

The Economy
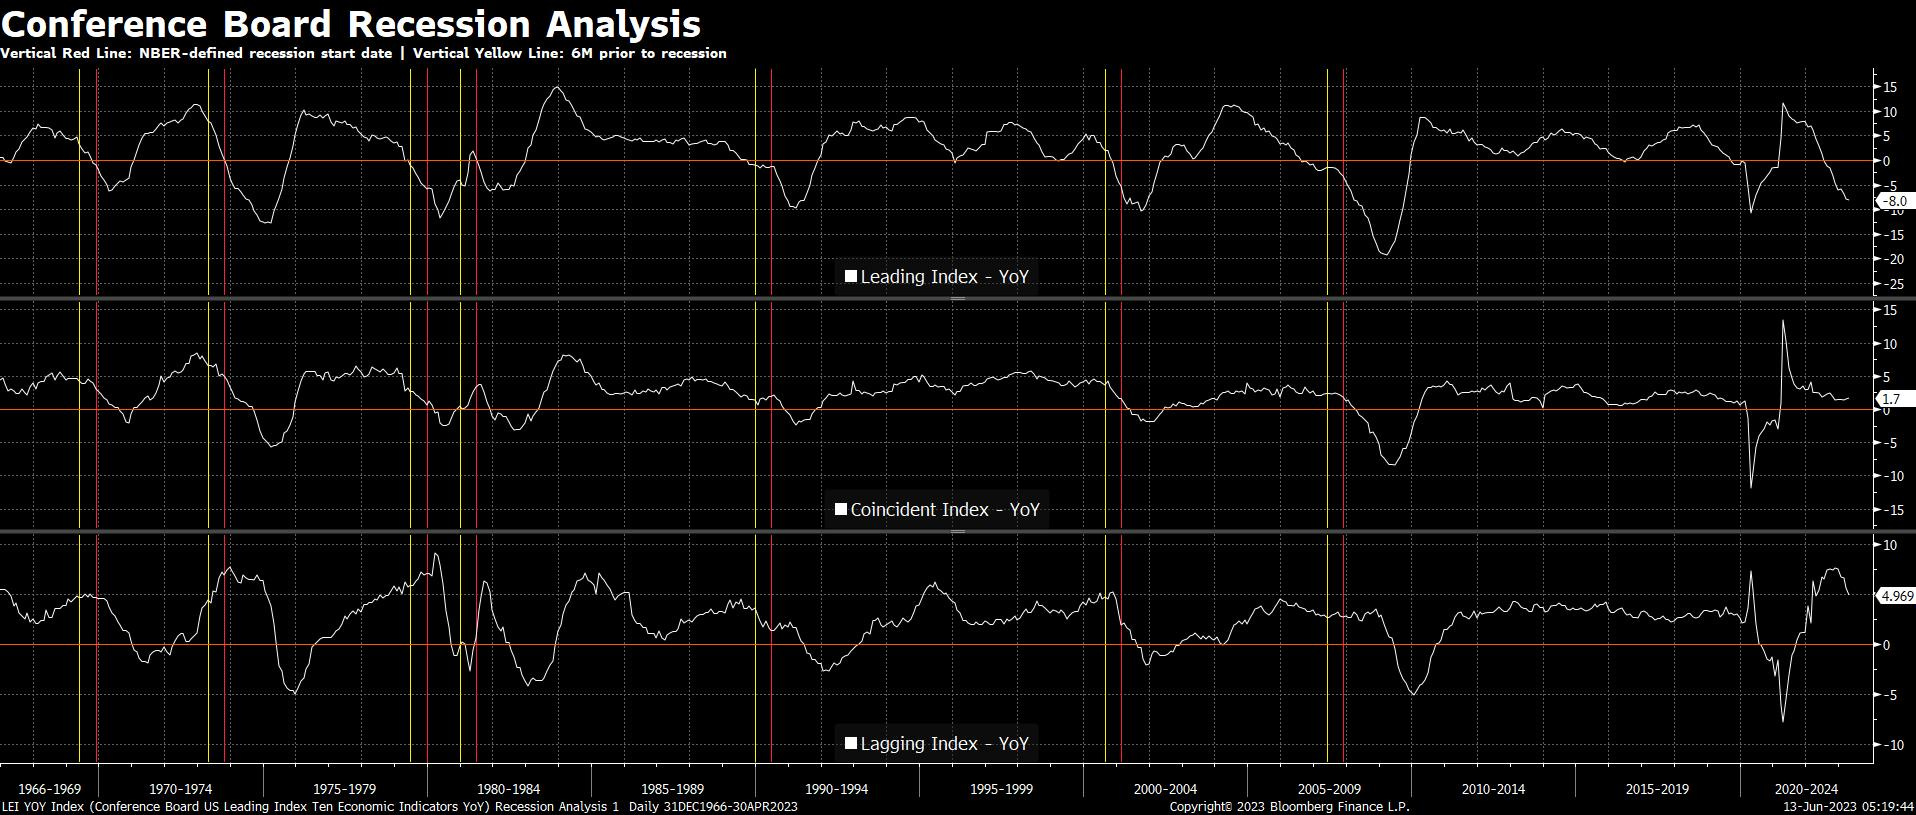
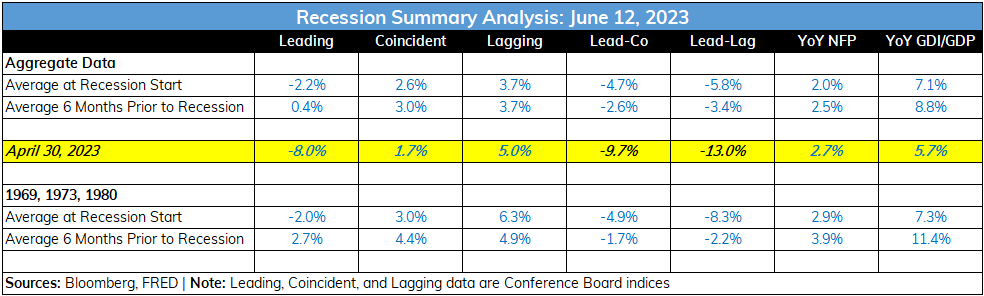
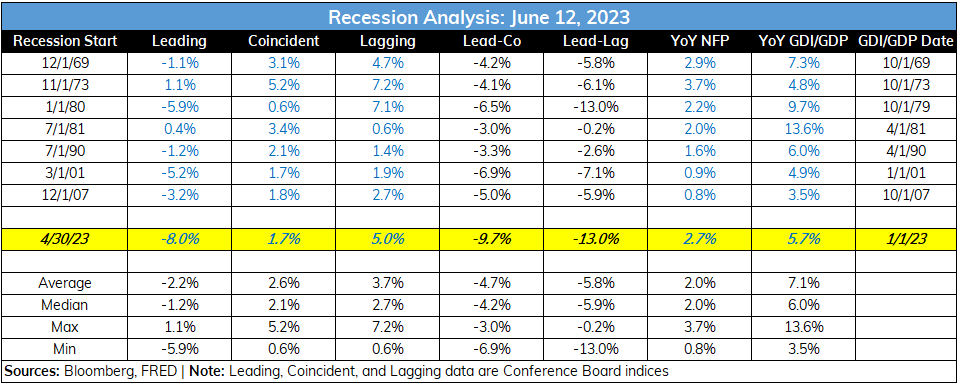
Going back to 1965, there have been just 8 instances (excludes the COVID recession, which would make it 9) of the Conference Board’s Leading Economic Index falling to at least -5% on a YoY basis. At -8% as of the end of April, this is now the 9th. Given the fact all 8 prior instances have been associated with NBER-defined recessions, this indicator alone says the US economy is either in or about to enter recession. But let’s dig deeper.
The very real strength of the labor market is the most commonly cited variable in concluding the US economy is not in recession or could in fact skirt one altogether (i.e. the much vaunted “soft landing” scenario). In May, nonfarm payrolls rose 2.7% YoY, materially above the 2% YoY average at the start of recession going back to 1965, and above the 2.5% average 6-months prior to recession. But here’s the thing, as ECRI outlined in a CNN op-ed back in January, in high inflation environments the labor market is a particularly lagging indicator:
Employment, in particular, can hold up longer than expected in a recessionary scenario. That was true in the inflationary era around the 1970s. Most notably, employment didn’t peak until eight months after the start of the severe 1973-1975 recession.
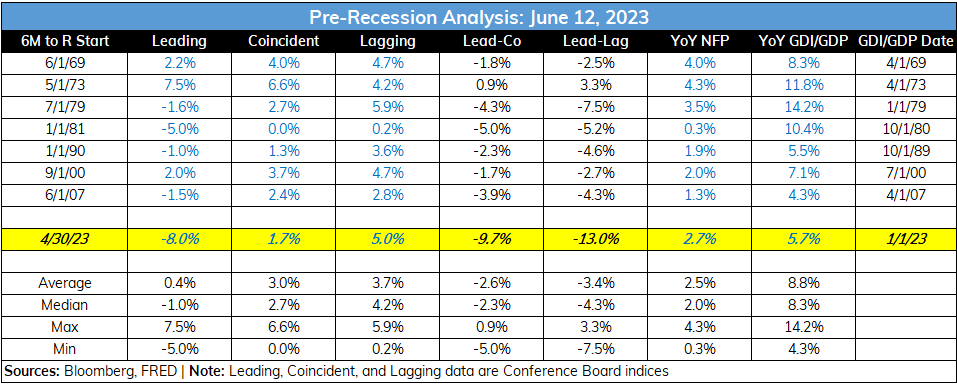
To ECRI’s point, if we home in on the 1969, 1973 and 1980 recessions the picture changes. At the start of each recession nonfarm payrolls grew 2.9% YoY, 3.7%, and 2.2%, for an average of 2.9%; and 6 months prior to those recessions payrolls grew 3.9% on average. Assuming the same “high inflation” dynamic holds for this economic environment, current payroll growth of 2.5% is not a negating factor in concluding the US economy is either entering if not already in recession; nor does it support the conclusion a recession is 6 months away given it is well below the 3.9% average 6 month prior to those high inflation recessions.
Perhaps the next most cited variable in concluding the economy is far from recession is the strength of nominal GDP growth. Last quarter the average of GDP and GDI grew 5.7% YoY, materially above the 4.8% average growth rate at the start of the 1990, 2001, and 2007 recessions, and right in line with the average growth rate of 5.6% six months prior to those three recessions.
But again, if we home in on the three high inflation recessions of 1969, 1973 and 1980, the picture changes. At the start of those three recessions YoY GDP/GDI growth was 7.3%, 4.8% and 9.7% for an average of 7.1%; and 6 months prior the average was 8.8%. By no means does the most recent GDP/GDI YoY growth rate of 5.7% negate the conclusion a recession is coming if not here already.
The bottom line is this: With market consensus solidly in the “soft landing” camp largely as a result of a still-strong labor market and still-reasonably strong nominal GDP/GDI growth, there is a significant “variant view” to be had by focusing one’s analysis on the high inflation recessions of the 1970s and 1980s.
Exhibits

The Stop Loss
The “stop loss” to this bearish outlook for the economy and stocks is simple: Once 90% of stocks move above their 50-day moving average - a signal that has marked the end of every single bear market since 1965 - The WOTE will change its stance.
Until then, bear market on.

Fantastic research and breakdown of everything💪🏽