

The Market: Mind the Gaps, Please

Discussion
As outlined by Bob Elliott in a much more timely and thoughtful manner than myself, the 6-12 month outlook for the S&P 500 is crystal clear. Bob outlined what I’ve been writing and talking about since July 2022 when the Fed committed to not repeating the “stop and go” policy error of the Burns Fed in the 1970s - his timing is *just* better.
The 3-month outlook for SPX is a bit murky because it depends heavily on the direction of interest rates.
As discussed yesterday, if rates stay pinned right around here, economic data hang in (jobless claims especially), and the Fed stays calm, rangebound trading should be expected; but if rates break out here in the coming days/weeks, the backdrop of very weak underlying market breadth and poor seasonality sets SPX up for a 1987-style “event” sometime in October.
Even in the lead-up to the 1987 crash, it wasn’t entirely clear which direction SPX was going to take as it traded in a tight range until rates spiked one last time.

Compounding the “which direction will SPX take” question is the fact medium-term sentiment has cooled off but is not decisively oversold enough to bake in the fundamental risks that continue to pile up.

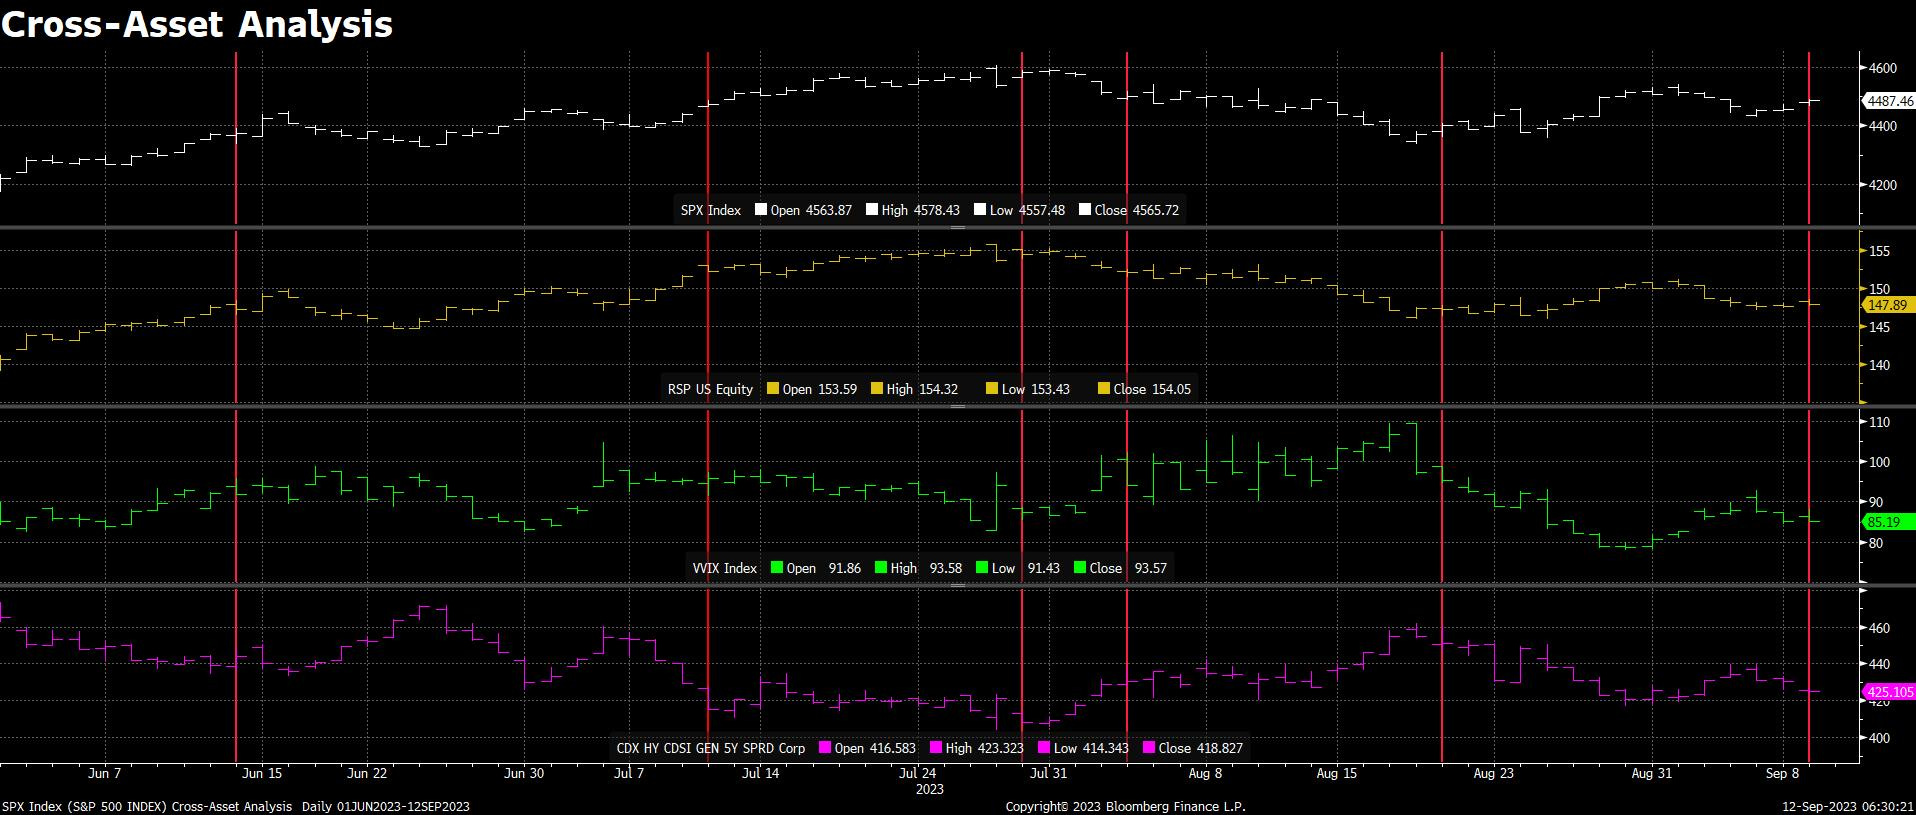
So what we’re left with in the short-term is looking for clues from cross-asset market analysis that might point to which way SPX wants to ultimately move.
At the current juncture, I believe underlying market breadth is pointing to a resolution lower. SPX has opened up a substantial gap with NYSE 50dma breadth that suggests SPX is at least 100 points too high relative to its last close of 4488.

Looked at another way, when SPX was 4488 in mid-August 53% of NYSE stocks were trading above their 50dma versus 37% today.

On a shorter-term basis, as noted on the private Xwitter feed yesterday afternoon the equal weight SPX ETF (RSP) gave back a significant amount of its early-morning gains through the day despite SPX moving to its HOD.

I was curious about the SPX vs. RSP relationship, so this morning I went back and looked at other times SPX closed above its opening price while RSP closed below its opening price. Since June 1 this has happened roughly five times excluding yesterday (there may be more instances that I missed), in all but one case SPX went on to print a lower price in the next two weeks. Looking at this relationship in the broader context of cross-asset market signaling, the only bullish instance came on July 12 in response to CPI, and HY CDX confirmed the move in SPX with a decisive close on the lows that day.
In short, I have a very tough time seeing SPX make it back to its post-JOLTS high on this latest oversold bounce.
Zooming out, SPX retains substantial gaps versus HY CDX and UST 30s going back to 12/31/2021. These gaps are not for the short-term trading book, but they are certainly something to keep in mind when thinking about downside potential into October.

