

The Outlook: Bullish Across the Board, but...
The Outlook: Bullish Across the Board, but...
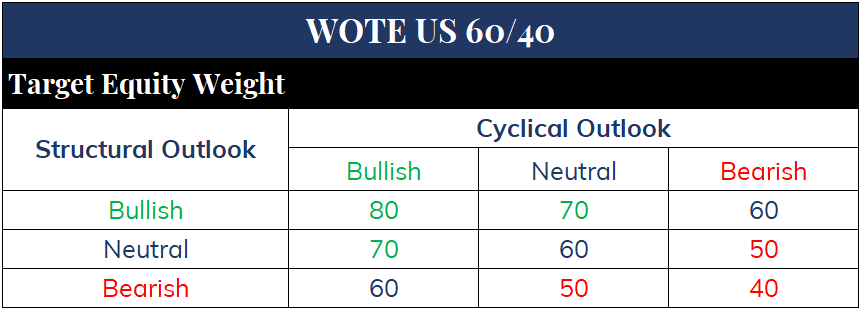
With the structural (2 years) and cyclical (12 months) outlooks for the S&P 500 solidly bullish, the biggest question is the tactical (8 weeks). Tactical indicators are oversold, but...Israel-Iran.

Discussion
With the equity market in pullback mode in the wake of a hot CPI report and the threat of escalation in the Israel-Iran conflict, it’s a good time to zoom out and assess the outlook for the S&P 500. For reference, as illustrated and defined below I break the SPX outlook down into three durations:


Structural Outlook: Bullish
With the YoY rate of change in initial jobless claims currently negative, the probability of a recession organically hitting the US economy in the next 3-6 months and kicking off a -35%+ decline in SPX over the subsequent 18 months is extremely low. If Iran bombs Israel and oil goes to $200, sure, that type of shock could send the economy into recession. But outside of that type of exogenous shock, the only thing that could send the economy into recession is the Federal Reserve.

The March CPI report this week was a game-changer for the Fed, as detailed by Nick Timiraos. A soft landing is now very much in question, but the key question for the structural outlook is whether the Fed needs to engineer a recession to bring inflation back to target - and that question is multi-faceted.
First and foremost, the Fed will not engineer that recession ahead of Election Day.
If we get past Election Day and inflation has *simply* stabilized around 3%, will the Fed still seek to engineer a recession, or will they just continue to hold Fed Funds at 525-550? I don’t know.
But if YoY inflation stair-steps higher from now until Election Day, up to around 4-4.25% on CPI, the Fed absolutely will restart rate hikes at the December FOMC meeting in order to engineer a recession in 2025.
For now, the economy is safe from recession at least until Election Day; and since the Fed’s reaction function post-Election Day is so uncertain, the structural outlook rating remains bullish.
But, realized inflation, inflation expectations, and FED guidance will be critical to monitor over coming months - especially realized inflation. If YoY inflation readings really start to accelerate higher, equity market upside will be very limited if not nonexistent.
Portfolio Implication
With the structural outlook bullish, the lowest I’ll take my 60/40 equity exposure is to neutral, or 60% of the portfolio. How far above 60% is determined by the cyclical outlook, discussed below.
Cyclical Outlook: Bullish
The Quantitative
In the December WOTE Report I outlined the case for SPX 5500-6000 in 2024.

Based on how SPX has performed since the 50dma thrust signal fired on December 26, the market remains firmly on track for the 5603 target by the end of this year, 9.4% above Friday’s closing price of 5123.

9.4% of upside is close enough for government work to 10% for rating the cyclical outlook. Now the question is the probability of realizing that 9.4% move, and for that answer we again turn to the history of the 50dma thrust signal.
As of Friday’s close, SPX is up 9.9% from the December 26, 2023 signal date, 63 trading days into the 253-day forecast period. Out of 20 prior 50dma thrust signals since 1970, only once has the 253-day return ended up lower than the 63-day return, and only twice has the 253-day return not been substantially higher than the 63-day return.

In short, the historical record of the 50dma thrust signal - the most powerful breadth thrust signal in the toolkit - strongly suggests the cyclical risk/reward for equities here skews heavily bullish. And other quantitative evidence confirms: 200dma breadth remains consistent with a robust cyclical bull market, and aggregate investor positioning is not yet extreme enough to impede the advance.


The Qualitative
In the March 28 WOTE Report I detailed the five “puts” currently sitting beneath the S&P 500:
Yellen/Brainard
Liquidity
The Fed
Fiscal Stimulus
AI Flows
(I’ll leave fiscal stimulus and AI flows alone for now and focus on the first three below, as they are far and away the most important.)
The Yellen/Brainard Put
Far and away the most important “put” is Yellen/Brainard. As of March 28, the largest pullback SPX had suffered YTD was -2.54% despite FED re-hawking in response to an economic reacceleration, objectively hot inflation prints, and rising rates.

Fast forward to today: rates have broken out, Israel-Iran is escalating, and the Fed has begun the process of taking a soft landing off the table…yet SPX was down just -2.98% at Friday’s low.

Yes, SPX could open lower still on Monday, bringing the pullback to 3.5-5%. But make no mistake: the Yellen/Brainard put is in full effect behind the scenes right now. Based on where long-term US Treasury rates are right now and what realized inflation is doing, SPX has no business trading at 21x 2024 “Street” EPS estimates (5123/243). A still-too-high multiple of 17.5x would mean SPX 4253.

I will be shocked if Yellen/Brainard let SPX draw down more than -5% at any point from now until Election Day, and given the unlikelihood of Israel-Iran breaking out into a regional war, there is a better than average chance the lows of the pullback were seen on Friday. But that’s very tactical and not all that relevant to the cyclical outlook. The fact of the matter is policymakers sit firmly beneath this market.
The Liquidity Put
One of the factors driving the current pullback is an out-sized liquidity suck from tax payments: It’s estimated that upwards of $300-500 billion could be sucked out of bank reserves and into the Treasury General Account (TGA) around the April 15 tax deadline. Two things:
If you needed to sell stocks to pay your April 15 tax bill, that sale has already happened. So, while a $300-500 billion liquidity suck next week would likely impact overall financial conditions, the bulk of the direct effect on stocks is likely over.
Fed/Treasury policymakers will not want to see $300-500 billion taken out of bank reserves almost overnight, and they have direct control over the outcome. Janet Yellen can and will simply spend down whatever goes into the TGA from tax payments back into the financial system, immediately relieving any financial conditions hiccup. But this is important - because the tax-related selling of equities had to conclude ahead of April 15, any liquidity Yellen adds to the system in the coming days will have a pure impact on the equity market. In other words, her liquidity injection will not simply offset tax-related equity selling because that selling is already complete.
That’s the near-term liquidity put. Looking out to Election Day, Fed/Treasury policymakers have over $1 trillion of liquidity sitting in the TGA and RRP1 that can be deployed to limit financial market volatility and/or manage/halt the rise in long-term interest rates.
The Fed Put
The March CPI print definitely dented the power of the Fed put here, as the Fed now has a lot less room to protect economic growth and the labor market without risking a second wave of inflation. But the put is still there, as evidenced by the fact the OIS market still has the Fed cutting rates by the end of this year. Until the OIS market starts pricing in a resumption of hikes, the threat of rate cuts will continue to act as support to financial markets.

The Cyclical Outlook
Adding up the quantitative and qualitative evidence, the cyclical outlook for the S&P 500 is solidly bullish with maybe -5% downside potential and at least a 75% chance of a 10% rally from last close (SPX 5123).
Portfolio Implication
With both the structural and cyclical outlooks bullish, I want the 60/40 strategy in a maximally bullish posture.

For the long/short strategy, a bullish structural/cyclical outlook configuration means I can take the equity exposure up to a range of 200-300%2. Where the exposure falls in that range depends on the tactical outlook, discussed below.

Tactical Outlook: Bullish
As I type at 4:47pm EST, news is out that Iranian drones are headed for Israel. If this is about to turn into an all-out regional war, then all bets are off on the tactical 8-week outlook and perhaps the cyclical outlook depending on the impact on oil and rates. We shall see.
But, as of Friday’s close, NYSE 10-day advancing volume and SPX 50dma breadth are at levels that tend to market tactical lows in high-velocity bull market advances such as those seen in 2013, 2017, and 2021.
Again, barring an all-out regional war between Israel and Iran, these tactical indicators suggest a high probability of at least 5% rally from SPX 5123 over the next 8 weeks, putting the tactical outlook rating in the bullish camp.


Israel-Iran
As I said on Friday, I believe the sharp reversal in Gold ahead of the weekend suggests the Israel-Iran conflict is not about to turn into a regional war. We’ll see how this unfolds over the next 24 hours, but Iran has very, very, very little incentive to get into an all-out regional war given the US/Israel could wipe them out over night.
Further, the Biden administrative has very, very, very little incentive to not do whatever it takes to end the conflict ASAP in order to preserve its re-election chances.
More to come.
TGA and RRP facilities.


For reference, 300% long equity exposure is the mathematical equivalent of being -100% short against a 100% S&P 500 benchmark. If the portfolio is short -100% and SPX rallies 10%, alpha is -20%. Likewise, if the portfolio is +300% long and SPX falls -10%, alpha is -20%.