

The Outlook: A Perfect Bullish Storm. However…
The Outlook: A Perfect Bullish Storm. However…
Why the AI boom (in addition to large-scale and persistent fiscal stimulus) is likely to underwrite SPX 6000-7200+ in the coming years…assuming inflation stays below 3%. However…

Discussion
I have completely mismanaged this market YTD. Interestingly, I have done so by following my process. Coming into this year I identified rising rates, higher break-evens, and more hawkish than expected policymaker rhetoric and action as key triggers to come off my bullish worldview established last December. As all the triggers fired over the course of January and into February, I gradually built up a bearish position on equities based on the thesis that while downside was likely limited to SPX 4500, upside was very limited based on the factors that underwrote the rally off the October 27 low going into reverse. With sharp one-day moves down in SPOOZ in response to Powell on January 31 and CPI on February 12, I got the reaction I was looking for based on my “quantamental” work, yet the market has consistently reversed hard back to the upside.
CLEARLY, something else is afoot. IMO, that something is AI + fiscal. The AI infrastructure buildout is the real deal. It is far from hype, and if and when the market actually enters the hype phase, look for SPX to trade upwards of 25-30x $240 EPS, or 6000-7200. And while the case can be made that the AI boom doesn’t necessarily need to result in the overall market going higher - rather, just a standard rotation from non-AI to AI-related equities - I have high conviction that international equity capital is going to be a consistent bid for US-based AI exposure as a result of America’s advantaged position in the space underpinned by bountiful low-cost energy and relatively loose Tech regs. And this brings us to the fiscal side…
With the US government printing 5-10% of GDP into US private sector net worth every year and running an international trade deficit, there is a tremendous amount of new $$$ that need to find an investment home. Of course, a good chunk will simply sit in T-Bills collecting 5-5.5%, but when net worth rises, logically, risky-asset investment demand rises in close concert with “excess net worth”. The AI boom is almost the picture-perfect risky-asset vehicle for absorbing the vast amounts of excess net worth coursing through the global financial system right now, creating a perfect bullish storm for the economy and stock market.
The Perfect Storm
AI is a secularly transformative technology that will at bare minimum maintain humanity’s persistent productivity growth profile for decades to come. At best it will result in a step-change higher in productivity growth, as vast swaths of the workforce are freed up to engage in manual labor outside the scope of high-performance computing power. For instance, think of the Tech innovations that will come from an otherwise brilliant coder that can be redeployed to think of new ways to deploy AI; or perhaps more plumbers come into the market, forcing wages lower and the overall plumber employment landscape to reimagine how to conduct plumbing more efficiently. The possibilities are endless. And while it’s good risk management to say the ultimate reality of AI is likely to fall somewhere in between maintaining the current productivity growth profile and driving a step-change higher, I don’t think that’s the case. I think it’s more likely I’m underestimating the positive long-term ramifications of the technology.
With realized inflation readings below 3% on a core PCE basis, the equity market is 100% free to speculate that AI will keep economic growth high and inflation low, transform the global economy, and lead to a persistent bid from international equity capital for US-based companies in a highly advantaged position with respect to the AI boom. Until realized inflation reaccelerates back above 3.5% (and who knows if even that would halt the boom), there is little in the way of SPX entering a full-scale valuation bubble of 25-30x earnings, if not upwards of 35-40x. At $240 EPS, 25-30x = 6000-7200 and 35-40x = 8400-9600. Yes, those figures are high, but if you think about the fact the US is running a 5-10% of GDP fiscal deficit, $240 EPS is likely too low looking out 2-3 years and SPX could get into these ranges with less P/E expansion.
But inflation is the key. With YoY core PCE inflation below 3% and trending lower, the Fed is in a position to defend the economy with targeted rate cuts and balance sheet expansion if needed. The AI boom needs to allow the economy to thread the needle of 5-6%+ nominal GDP growth with 2-2.5% inflation. Otherwise, if all of this demand results in a reacceleration of inflation back above 3.5% and/or more importantly inflation expectations moving back above 3.5% across the TIPS break-evens and inflation swaps curves, the Powell/Waller Fed will respond with more hikes. While it’s unlikely the equity market will blow through a resumption of hikes, more rate hikes may not have the impact inflation hawks such as myself would expect. Eyes wide open is key.
So what does this mean?
Portfolio Construction
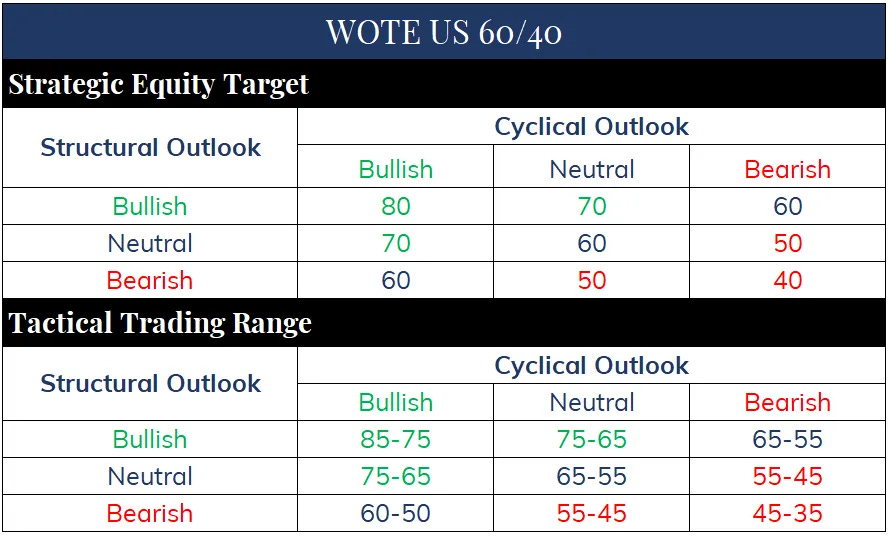
I look at the world through the lens of three durations: structural (1-2 years), cyclical (2-12 months), and tactical (4-8 weeks). The bullish outlook discussed here covers the structural and cyclical durations, a decisive upgrade from the last update on February 1, as illustrated below.
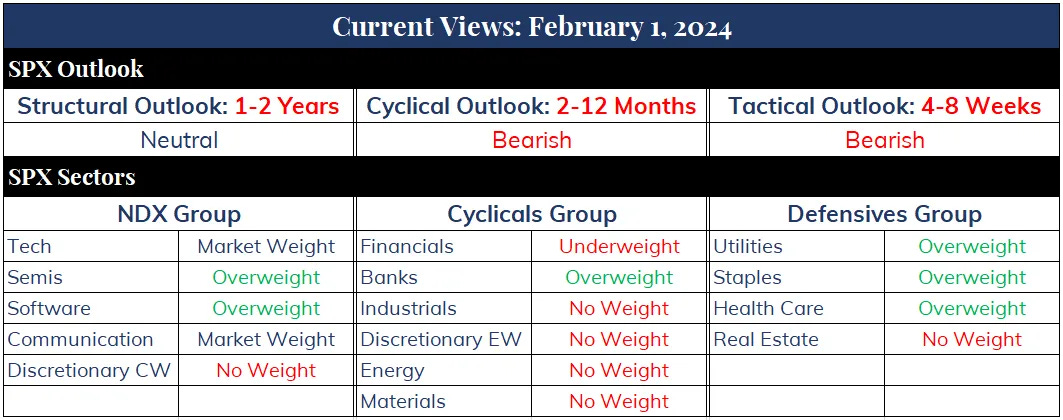
The upgrade stems from the fact that previously I was way overweighting the interest rate, inflation, and FED components of the outlook, and not properly accounting for AI + fiscal; and means I will be upgrading equity exposure at the proper time according to the framework illustrated below.

However…
The Trader
For all of this bullish talk, now is not the time to rectify my mistake and upgrade exposure. But before I go into why, a quick word on short term trading…
The defining feature of my approach to markets is that I suck in as much evidence as possible from as many sources as possible. Over time, the sources of evidence get whittled down, sometimes expanding back out depending on market circumstances, and whittled back down again.
In my time on Twitter/X (I prefer “Xwitter”) over the years I’ve developed a good network of traders with approaches to markets that I respect and complement my own. Where I get the most value from these traders is over a tactical time frame (4-8 weeks). I’ve developed my own approach to tactical market conditions - I call it The CASP - and it’s a good framework through which to interpret other tactical trading systems, but it’s still not good enough to stand on its own.
Back in September I stumbled across a trader (let’s call him/her “The Trader”) who saw the market set-up very similarly to what I was seeing through The CASP. I have followed him/her ever since and have since been blown away at the accuracy and consistency of their approach. I’ve left a nauseating amount of $$$ on the table by not more intentionally incorporating their signals into my process since late October.
No more.
The Tactical Outlook
At present, I am more bullish than The Trader. They see downside to 4600 in the next 8 weeks and I’d be shocked if we get past 4900. But that’s why The Trader is such a great complement to my process. They see things developing in price in advance of The CASP, almost entirely devoid of any macro-related forecast.
Now, The Trader is just one of 4-6 key traders I respect and follow, but another 1-2 see a similar set-up for weakness in the March-May time frame. I went into the March-May event path ahead in the Market Journal post below.
