The Outlook: Downgrading the Cyclical Outlook
TIPS break-evens have slammed shut the door to upside beyond the 4818.62 SPX ATH in the near-term. Breadth divergences point lower, but downside likely limited to SPX 4300-4500.
Discussion
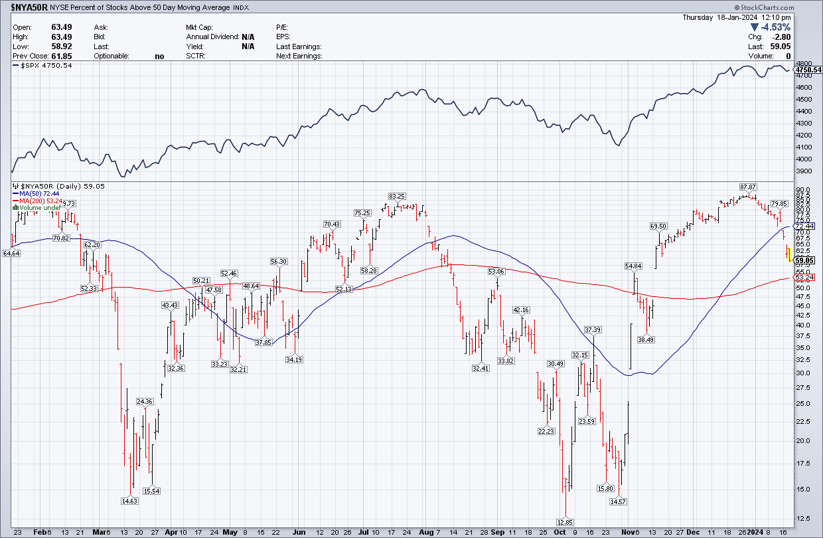
On December 26, 2023 over 90% of US stocks traded above their 50-day moving average, historically one of the most powerful breadth thrust signals: Since 1970, never once has the S&P 500 been lower 12 months later on a price-only basis. This signal was critical to our cyclical outlook upgrade in late 2023 in the wake of the Fed’s decisive pivot toward a rate cutting/labor market defense posture.
Downside to equities is relatively limited in an election year with Biden trailing Trump in the polls, the deficit running at 5-10% of GDP, and Yellen and Brainard sitting on powerful liquidity tools. But with positioning reversing off relatively full levels, and TIPS break-evens and the long end of the UST curve on the move, all three of our key downside catalysts detailed in the December 21 WOTE Report are in the process of triggering, the combination of which severely limits equity market upside from current levels.
In short, the time to get cyclically bullish again likely comes somewhere around SPX 4300-4500 sometime in Q1.
Discussion Exhibits
Nothing, absolutely nothing gets the Fed to move faster in either direction than a sharp and sustained move in inflation expectations. With TIPS break-evens on the move again, not even the prospect of a Trump reelection will stop the Fed from re-hawking. Hugely critical development so far YTD that blunts the upside potential to equities as signaled from the 50dma thrust signal discussed above.
With the OIS market still pricing in cuts starting in March, the Fed has more work to do to wrestle cuts pricing out of the first half of 2024. As we type FRB Atlanta President Bostic is on the air reiterating, yet again, that cuts won’t come until 2H24.
At 437 UST 30s are well into the zone of discomfort for equities. At minimum these levels limit SPX upside from here, and a push through 450 would very likely cause SPX to yield to the negative breadth divergence currently in place that calls for SPX 4500…
Both NYSE 50dma breadth and the NYSE advance/decline line point decisively to SPX 4500.
And lastly, positioning/sentiment is rapidly coming in. At some point positioning/sentiment will become oversold enough to warrant an upgrade to the cyclical outlook, but given the aggressive shift in the Fed’s stance and the negative divergence that’s developed, the market just isn’t there yet.
The CASP
VOL: Starting to stick. Day to day there is some volatility in the trend, but zooming out VOL is starting to point lower for equities looking out 4-8 weeks.
CDX: Not yet indicative of immediate equity market downside. Still trading pretty limp given the risks building, but this indicator can be pretty coincident so need to read the signal against the broader backdrop of evidence.
FICC: See discussion and exhibits above. Decisively bearish for equities here.
Market Character: Topping process appears to be underway.
Flows Windows: The window for bullish EOY/BOY flows has shut and the window of weakness has opened.
Tactical Analysis: Given the Yellen/Brainard “put” in place this correction is likely to be lumbering. We expect a see-saw decline into March in line with the historical tendency for the equity market when an incumbent Democrat loses.


