

The Market: “Mind the Lags, Please.”
The Market: “Mind the Lags, Please.”
2H23 SPX scenario analysis: 4600/4700 by 3800, 3500 or 3000 depending on the path of the economy.


Discussion
I see three scenarios for 2H23:
Economy performs in line with the Fed’s SEP and they hike twice more to 550. Lags from past tightening limit upside, but ok earnings limit downside, resulting in a range-bound SPX (3800-4600).
Economy outperforms the Fed’s SEP and they hike at the remaining four meetings to close 2023 at a 600 FFR. In this scenario the recent upturn in SPX EPS estimates probably has legs into YE, limiting downside to no lower than the October 2022 low of circa 3500. A breakout in the 10y UST note to 425-450 would likely be the catalyst for a move down to 3500 sometime in the classic danger zone of September/October.
Economy underperforms the Fed’s SEP and they maybe hike once more in July. Economy is far weaker than implied by recent market action and sentiment, lags hit in force, and SPX EPS estimates turn lower. A move down to the upper end of the recessionary bear market trough P/E range (around 15x) would bring the SPX to circa 3000. That’s -36% lower than 4700, a big move in four months if it were to happen by September/October, but a very logical outcome given the fact we have a valuation bubble wrapped in an aggressive tightening cycle…and assuming, of course, that the economy is weaker than “higher for longer” bulls believe.
It’s easy to see by the length of text discussing each scenario which way I am biased, but that bias is ruthlessly data-driven. I have zero interest in fighting a durable bull market advance. None. And frankly, it wasn’t until SPX accelerated higher starting in very early June that the fundamental bear case really started to be called into question.
Here’s why the third scenario continues to be my base case outlook:
If this is a new bull market kicked off last October, this is the first one in the data going back to 1969 that was not accompanied by the 3y/10y UST curve moving out of inversion and 90% of stocks moving above their 50dma. Until these two signals fire, history says to look down, not up. And not just looking out 1-3 years like on some higher time frame macro thesis - look down weeks and months ahead.
ECRI and EPB, both key members of my economics “team”, have the US economy very close to recession if not in one already. On my end this is confirmed by a very inverted 3y/10y UST curve, which is a recessionary sign in high inflation environments such as the 1970s and 1980s (unlike the low inflation 1990s and 2000s). The Kitty, another key member of the economics “team” is even more specific, outlining for months now that the September/October timeframe is when the consumer because materially more rate sensitive.
Back in April, former FRB Dallas President Robert Kaplan made the case that the fundamental lending fallout from the SVB shock was likely to hit within 3-6 months, a zone which we are just now entering. This is a lag on top of lags, and likely to exacerbate the lags.
Not only has the 90% 50dma thrust signal not fired, but broad equity market breadth, as measured by the NYSE equity-only advance/decline line (ADL) has made a series of decisive lower bear market highs against an S&P 500 making a series of higher bear market highs. The SPX itself has seen its ADL move to new a new ATH, a positive divergence from the Index itself still trading below its ATH and certainly a notable bullish development. But context is key: against the backdrop of a deeply inverted curve, weak broad equity market breadth, and an oncoming recession (if it’s not here already), the SPX ADL positive divergence stands alone.
A Combustible Set-Up
What makes this set-up potentially quite combustible is if the economy is in fact as weak as ECRI, EPB and the 3y/10y curve suggest, that means the latest round of Fed re-hawking is occurring directly into the teeth of a recession masked by the “money illusion” of a high inflation environment…
(“Higher for longer” bulls point to resilient coincident data as proof the economy is nowhere near recession, but history says current employment and nominal income readings are well within the range of recessionary in this high inflation environment.)

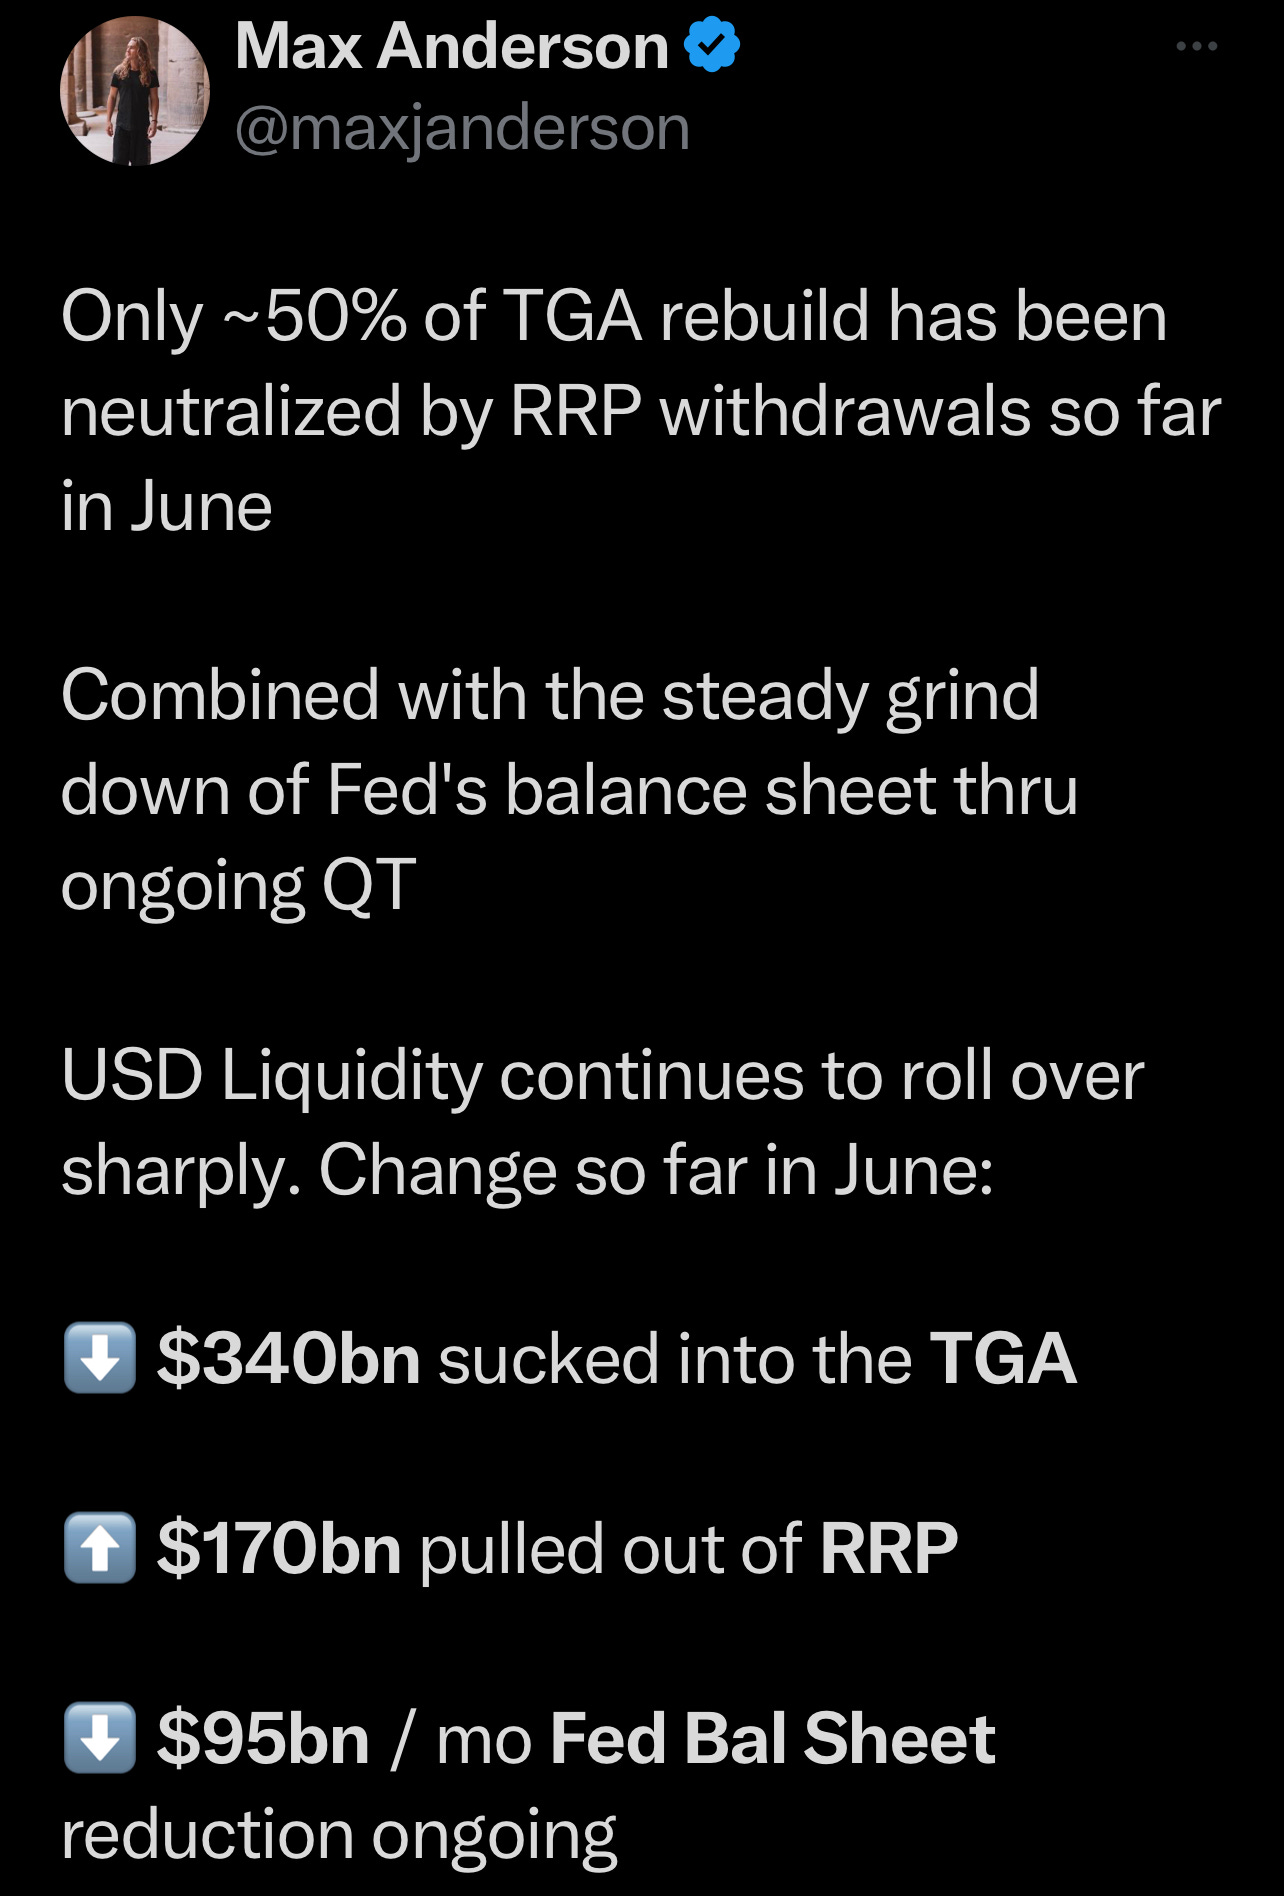
…With liquidity getting sucked out of the system…


…And the volatility and structured product markets underwriting a bear market squeeze of epic scale (see Karsan here).
I am simply weighing the evidence of the likely path of the economy. If I’m wrong on recession, then the Fed is *simply* re-hawking into a short squeeze sitting on top of a liquidity drain. If the economy performs in line with the Fed’s SEP, then the correction into September/October probably only takes SPX down to 3800; but if the economy outperforms the SEP, SPX will likely retest 3500 on Financial Crisis 3.0. Regardless, a stiff correction is coming into September/October from the 4600/4700 level some time in July.
Exhibits
An unbelievably negative divergence between the NYSE equity-only ADL and SPX. Not at all what should be seen in the early stages of a new bull market.

Same story for the % of NYSE stocks above their 50dma.

Now, the bullish offset to this is the fact the SPX ADL is at an ATH, a very positive divergence.

And there is some room to run on the Bullish Percent Index before SPX tops out here.

The “long and variable” lags of monetary policy are set to hit in 2H23 regardless. But the 3-6 month lag of the SVB shock is in the process of hitting right now, per Robert Kaplan commentary back in April. “Mind the lags, please.”