The FED: Rate Cut Analysis
Continuing jobless claims likely hold the key to the direction of long-term interest rates from here.
Discussion
The bond market is saying it’s time for the Fed to start cutting rates:
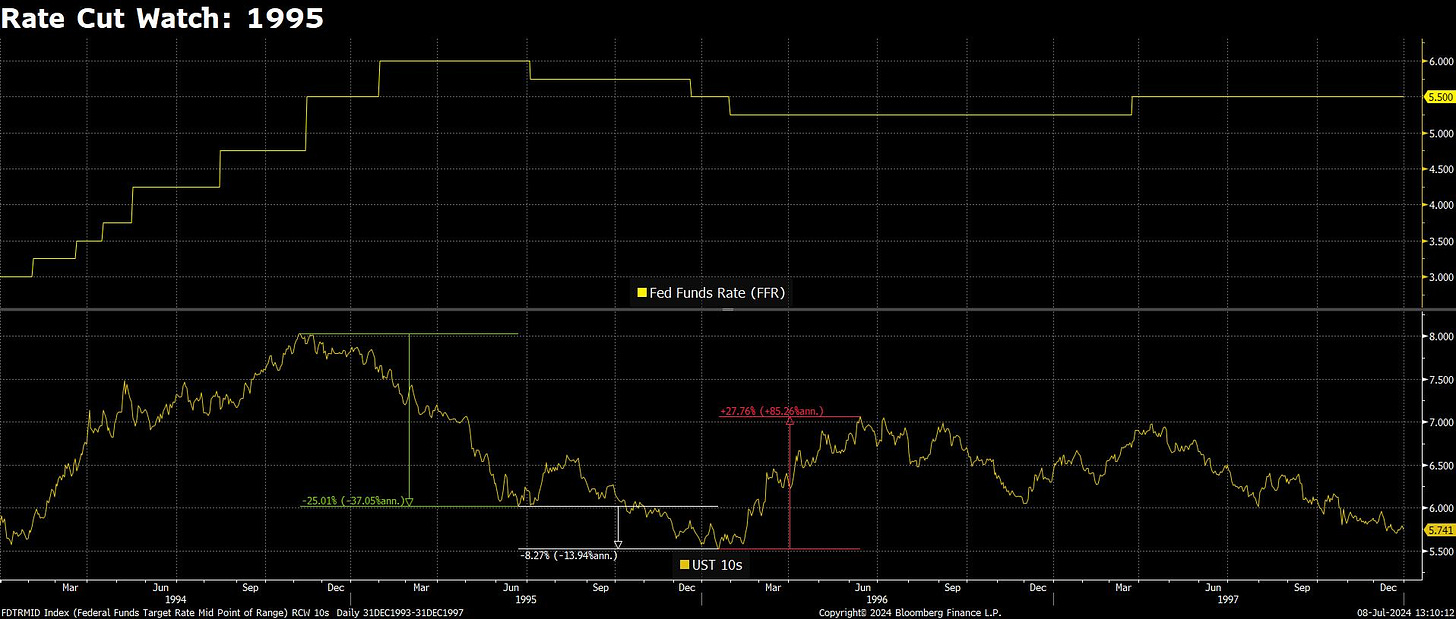
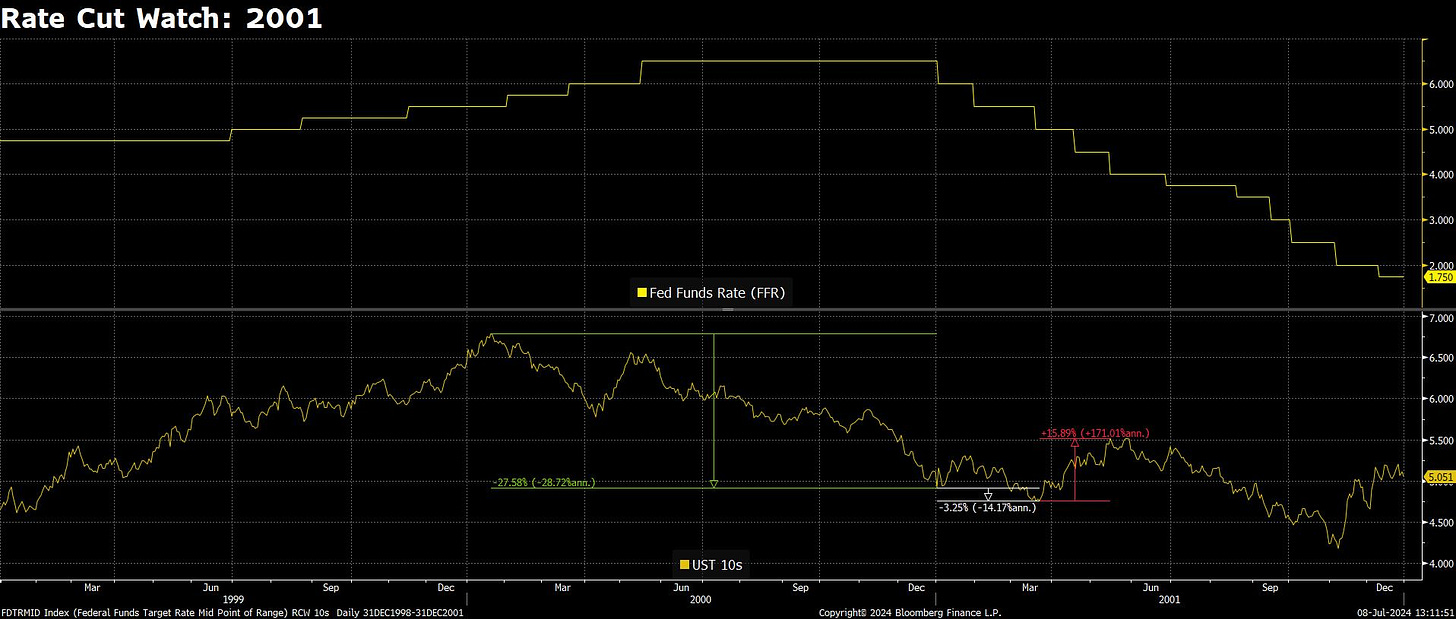
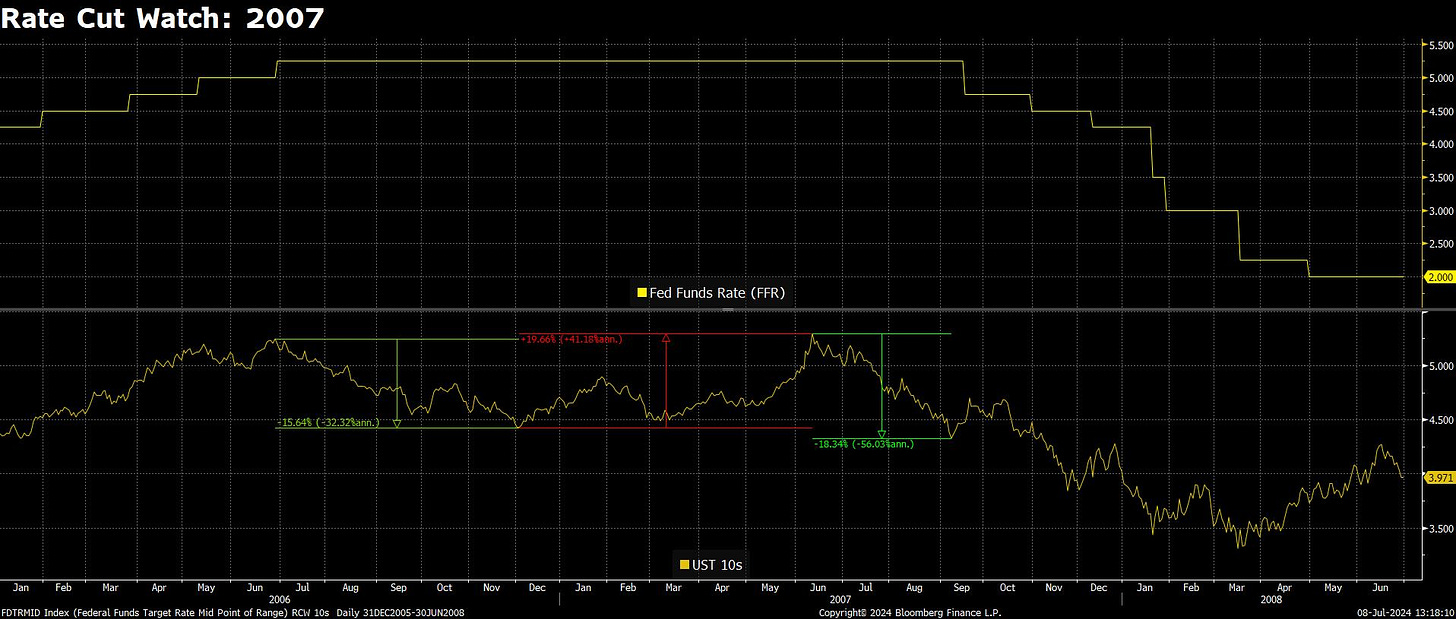
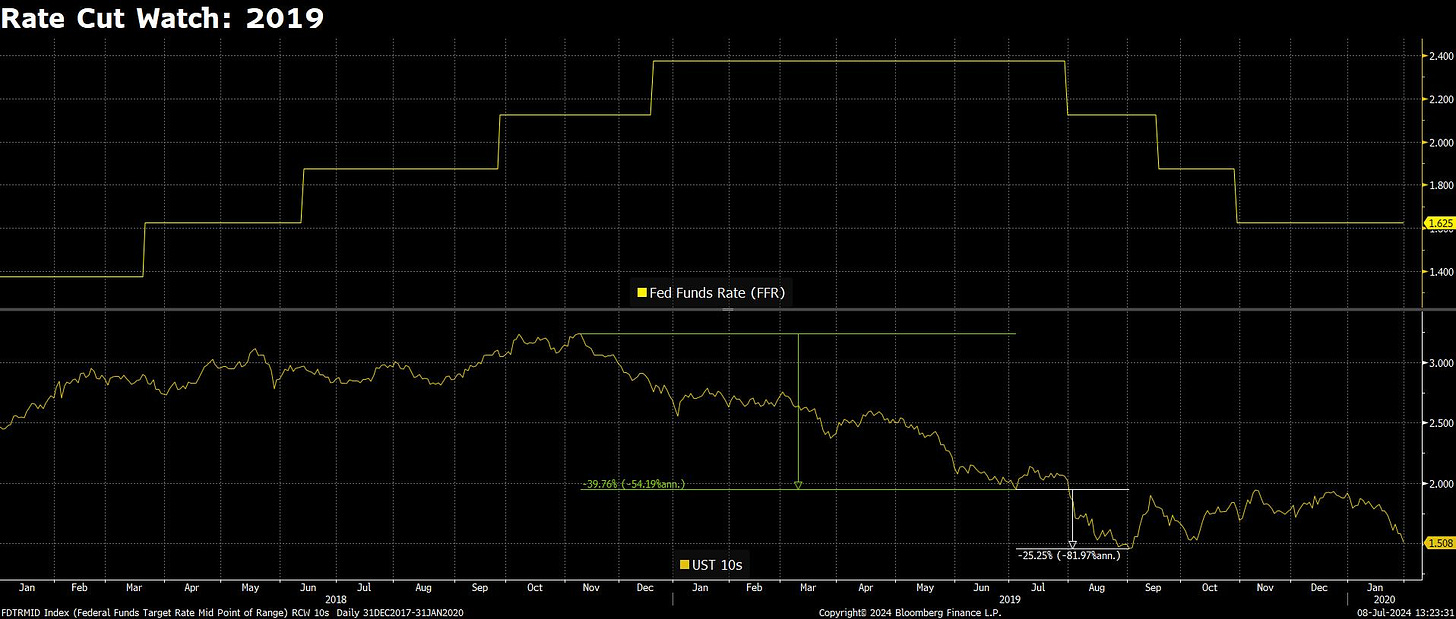
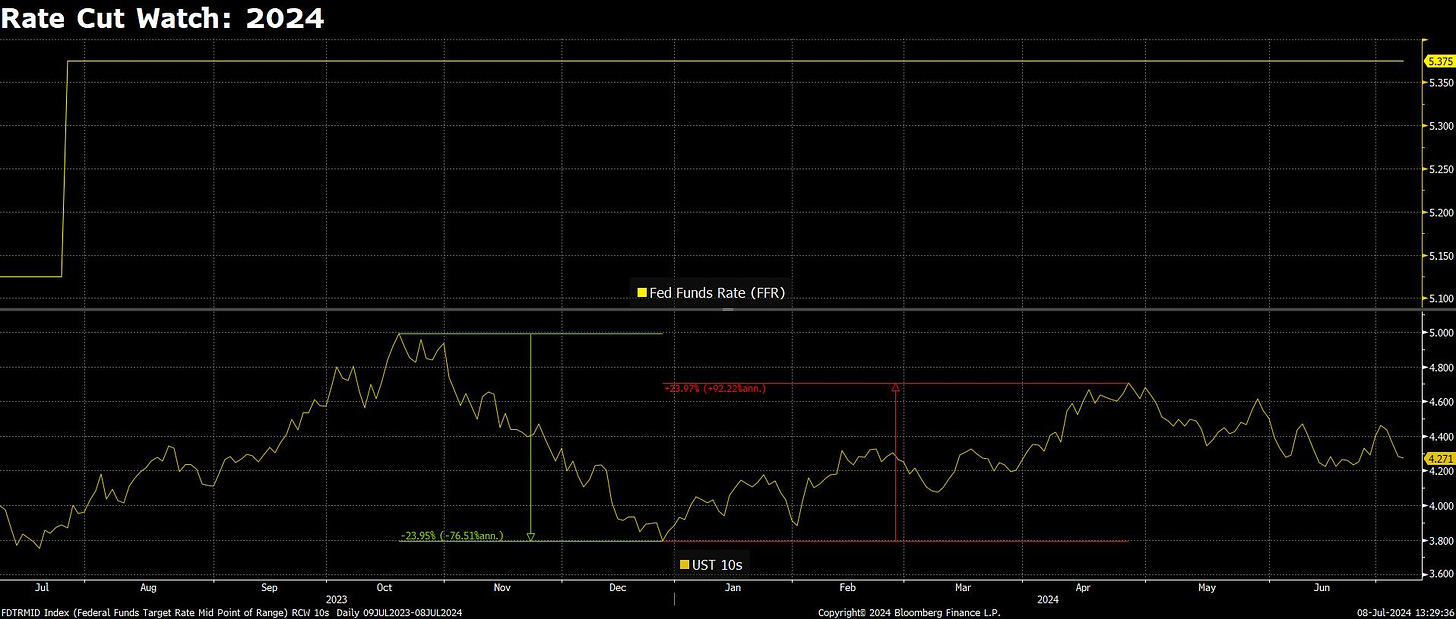
The FOMC has been on hold at a 525-550 Fed Funds rate since last July, the second longest holding period since 1995.
1995: 6 months
2001: 8 months
2007: 15 months
2019: 7 months
And since last July, the Fed Funds rate has averaged 113% and 125% of UST 2s and 10s, while the 6-month Treasury Bill rate has averaged 113% of UST 2s. These are shorthand bond market structure metrics that provide rough insight into the likely direction of FED policy, and all three are well above the holding period highs of the past four Fed Funds cycles. (Edited on July 9.)
1995: 94%, 89%, 94%
2001: 107%, 112%, 103%
2007: 111%, 110%, 106%
2019: 107%, 98%, 106%
But whether rate cuts are durably bullish for Treasury Bonds is up in the air:
In 1995, 2001, and 2019, UST 10s peaked just ahead of the final rate hike and then went on to fall throughout the holding period.
The 2007 holding period was more rangebound, and UST 10s actually went on to make a minor new high deep into the holding period.
Following the initial 2001 and 2007 rate cut, UST 10s went on to fall significantly as the economy entered recession.
In 1995, rates bottomed out soon after the Fed stopped cutting…which, as discussed below, is likely due to the fact the labor market reaccelerated.
2019 is tough - obviously COVID was the impetus for the plunge in rates after the Fed started cutting in July, but it’s tough to say whether the market was smart enough to sniff that out so far in advance.
Since the Fed went on hold in July 2023, UST 10s have behaved more like the rangebound action of 2007
, though this is the only cycle since 1995 that has seen UST 10s peak after the Fed went on hold. (Edited on July 9.)
Continuing Claims
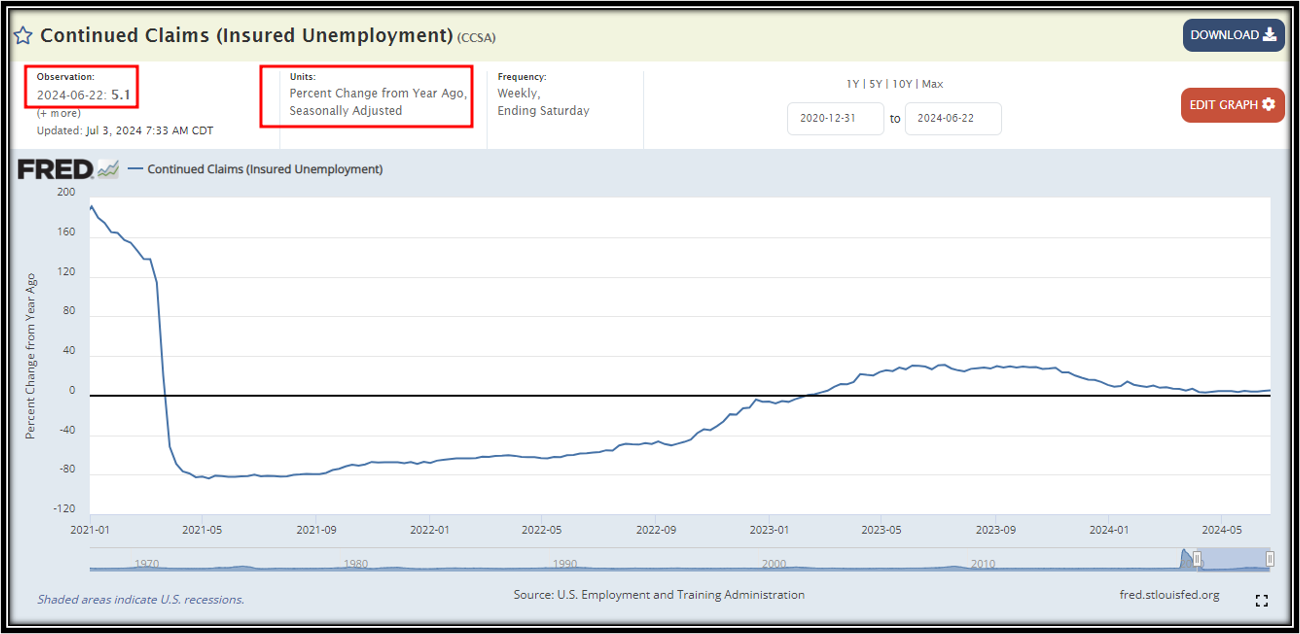
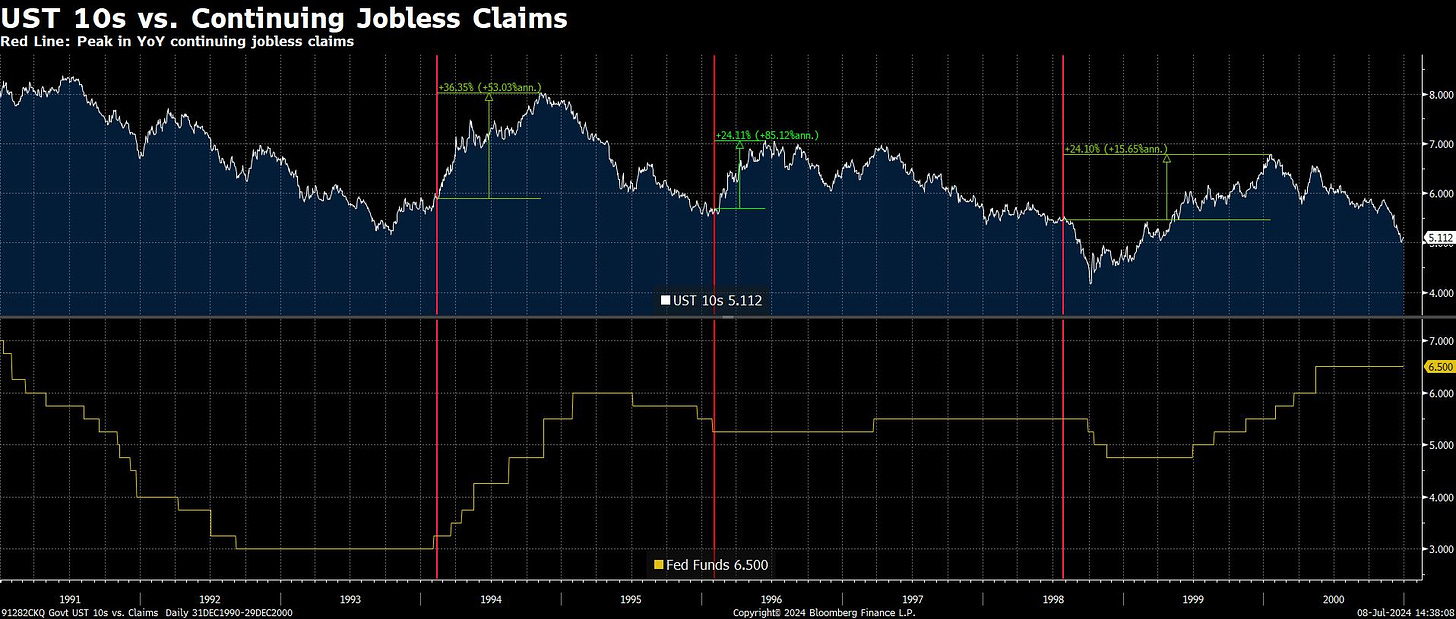
The direction of UST 10s from here is likely to be determined by the direction of continuing jobless claims. Currently sitting at 5% YoY…
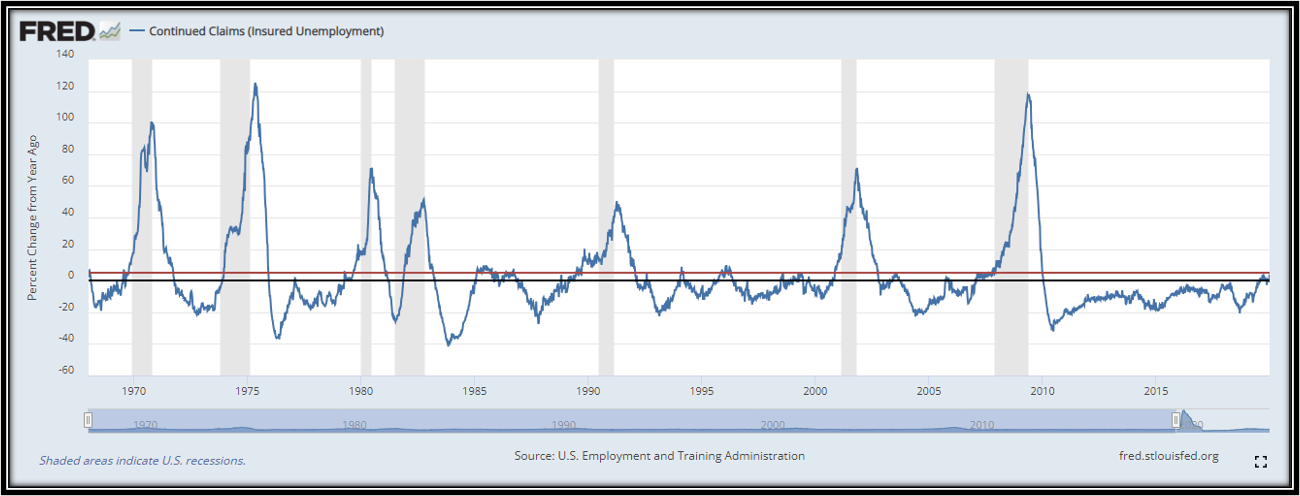
…continuing claims are at a critical threshold that has historically opened the door to recession.
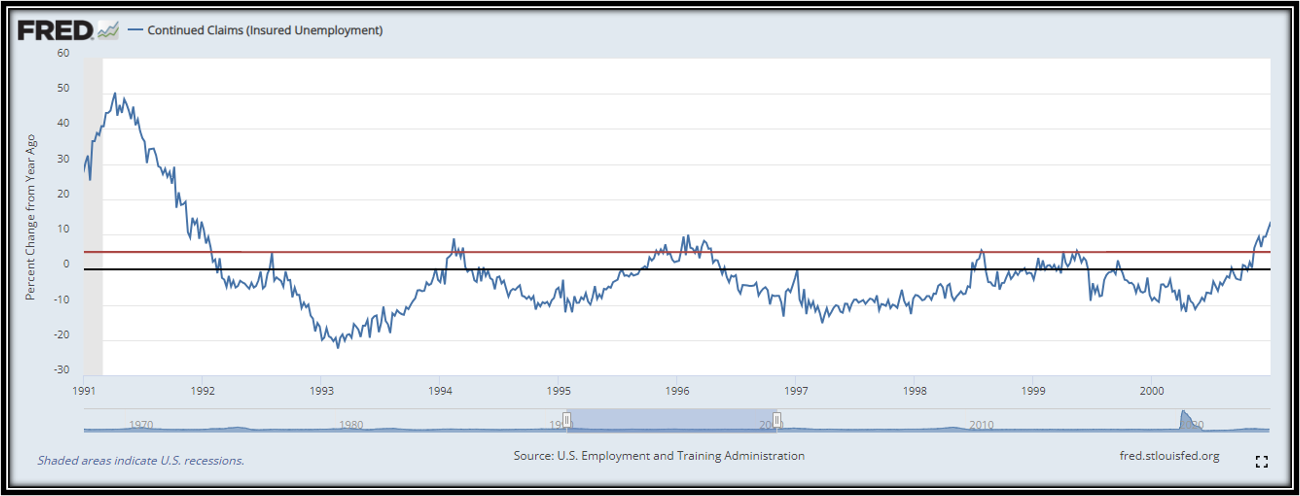
But given the economic reacceleration signals currently emanating from the “guts of the stock market”, I think the mid-1990s is a pertinent comp to today, where YoY continuing claims breached 5% without the economy falling into recession.
This happened three times, and all three times UST 10s went up at least 24% from the time once YoY continuing claims peaked (1998 was interrupted by an exogenous event, but rates still went on to rise 24%). (Edited on July 9.)
Again, given the economic reacceleration signals coming from equities, and the fact the US economy is running with a 5-10% fiscal deficit in place, I believe the mid-1990s is the pertinent comp here.


