

SPX Market Outlook: November 29, 2022
SPX Market Outlook: November 29, 2022
Navigating the Return to Normal

***PLEASE NOTE THIS IS FROM NOVEMBER 2022***
I am in the process of constructing an SPX Market Outlook piece that will build on and link to this November 2022 outlook write-up that was done prior to The WOTE in another forum.
The Bottom Line
Inflation is entrenched, and requires a recession, with tight monetary policy maintained throughout, to uproot it. Fed Chair Jerome Powell knows this and has demonstrated the resolve to do whatever it takes to uproot it. As a result, an economic contraction is the high probability baseline outlook for the US economy in 2023. An analysis of the 15 NBER-defined US recessions since 1929 suggests the S&P 500 should ultimately bottom somewhere between 1974 (bear case) and 3325 (bull case), with a base case bottom zone of 2478 to 3003.
The 3y/10y US Treasury curve will be the quantitative guide for determining when SPX has possibly entered a bottoming process, as it will tell us whether Fed policy is becoming easier at the margin, and thus incrementally friendlier to the economy and equity market. At almost 114% at present, its current configuration reflects the highly aggressive monetary policy tightening program currently underway and confirms the decisively negative outlook for the S&P 500 as we head into 2023.
The key stop-loss for this negative outlook is if the Powell Fed retreats from the War on Inflation - as the Burns Fed did in the 1970s - a retreat that would all but guarantee a substantial rally that could take SPX to its 4818.61 ATH by the end of 2023. If the Powell Fed does not retreat, however, we can look forward to a more normalized, healthy financial market backdrop by the end of 2024.
Executive Summary
Return to Normal. The Federal Reserve's mission to bring inflation back down to its 2% target has kicked off what will likely ultimately be viewed as a healthy, long-term economic and financial market normalization process. First is monetary policy normalization. Due to the fact the key forces that kept inflation low and stable for the last 30 years appear to be going in reverse (globalization, cheap energy, and cheap labor), it's plausible that the Fed will declare a victory of sorts once headline CPI sustainably falls to 3%, as forcing it down to 2-2.5% might require an unacceptably high unemployment rate. But because 3% would still be above target, Fed policy over the next economic cycle is likely to look nothing like the low rate environment of the last 10-20 years. Normalization of Fed policy once CPI reaches 3% could very well entail moving the currently projected terminal Fed Funds Rate (FFR) of 5% down to 4%, which would keep a 1% real FFR in place as an insurance policy against inflation turning back up in the next economic upswing.
Second, interest rate normalization. Over the very long-term, the 10-year US Treasury yield has on average traded 200 bps above YoY CPI inflation. As such, in a world of steady 3% CPI inflation, the 10-year should be expected to trade around 5%. Also over the very long-term, the 10y-2y curve has averaged a spread of 91 bps, which would put the "normal" 2-year at around 4.09% assuming a 5% 10-year. And given the discussion above about the normalization in monetary policy, a 4.09% 2-year lines up well with a "normal" FFR of 4%.
Third, S&P 500 profitability and valuation normalization. The SPX net profit margin (NPM) has climbed steadily higher over time, peaking at 7.4% in 2000, 8.6% in 2007, 10.2% in 2019, and 12.9% in 2022. A reversion back to the 2000 peak of 7.4% is likely too severe, but a return to somewhere between the 2007 and 2019 peaks (circa 9.4%) is very appropriate for a world of higher inflation, interest rates, and cost of labor. Also appropriate for this higher cost world is for the SPX P/E to fall to its long-term average of 17.5x. Applying a normalized NPM of 9.4% to current Wall Street estimates for 2024 SPX sales per share ($1873.10) yields normalized EPS of $176 in 2024. At 17.5 times $176, the SPX fair value by the end of 2024 is circa 3080.
Normalization Process. The return to normal is best viewed as occurring in three overlapping phases - monetary policy tightening (2022-June 2023), economic contraction (2H22 to 1Q24), and financial market normalization & economic recovery (2H23 to 2024) - and is underpinned by three key assumptions: 1) inflation is entrenched, and will require a recession, with tight monetary policy maintained throughout, to uproot it; 2) Fed Chair Jerome Powell understands what it will take to uproot inflation; and 3) Powell has the resolve to do what it takes to uproot inflation. Punctuated with a speech by one of Powell's top lieutenants, NY Fed President John Williams, on November 28 that projected a "hard landing" (i.e. recession) for the US economy in 2023, the body of Fed communication since mid-October overwhelmingly supports the outlook for a Fed-induced recession in 2023, a critical component to constructing an outlook for the S&P 500.
S&P 500 Outlook. With recession as the high probability baseline outlook for the US economy in 2023, the SPX outlook construction process can be narrowed down to how SPX has performed around the 15 NBER-defined US recessions since 1929. At the highest level of analysis, the average SPX decline and trough P/E over these 15 recessions is -31% and 9.4x, which would put the ultimate SPX low for this bear market at 3325 or 1974. Framing the outlook through the lens of historical macro regime analysis suggests the first recession of the Great Inflation period (1969) is a reasonable analog for today's market environment. In May 1970 SPX bottomed at a P/E of 11.8x, which would put the low for this bear market at 2478. However, the relatively low level of interest rates today can be a bit problematic for the 1970 analog. So, the 2000-2002 bear market is a decent alternative, where SPX bottomed at 14.3x with the 10-year US Treasury yield at 3.66% (more comparable to today's sub-4% yield than the 8.2% rate at the May 1970 low), which would put the ultimate low at 3003. Adding it all up, the distribution of projected SPX levels ranges from 1974 on the low-end to 3325 at the high-end, with 2478 to 3003 as the core of the distribution and an attractive zone to start looking for a durable bear market low.
SPX Bottoming Process. Over the four recessions in the Great Inflation period of the late 1960s to early 1980s (1969, 1973, 1980, 1981), SPX bottomed with the 3y/10y curve essentially flat at 102%. This contrasts sharply with the Great Moderation period (four recessions: 1990, 2001, 2007, 2020), where SPX bottomed with the 3y/10y curve at a very steep 59% on average. At present, the 3y/10y curve is at 114%, indicative of the highly aggressive monetary policy tightening program currently in place. Once this curve falls to around 100%, regardless of where SPX is trading we must go on high alert for the possibility a durable market bottom is close at hand. That being said, there is a lot of space between the Great Inflation and Great Moderation averages (102% versus 59%). The fact of the matter is the ultimate low for this bear market will not be confirmed until a powerful set of "breadth thrust" signals fires with Fed policy clearly at the economy and market's back. That may come with the 3y/10y curve at 100% or 50% - we won't know until we get there.
DISCUSSION
Return to Normal
The current bout of high inflation and the Federal Reserve's desire to bring it back down to its 2% target has kicked off what will likely ultimately be viewed as a healthy, long-term economic and financial market normalization process that results in the following set of historically "normal" conditions by late 2024:
Real 10-Year US Treasury Yield: 2%
10y-2y US Treasury Curve: 91 bps
S&P 500 Net Profit Margin: 9.4%
S&P 500 P/E: 17.5x
The normalization process is best viewed as occurring in three overlapping phases:
Phase 1: Monetary Policy Tightening | 2022 to June 2023
The Overnight Indexed Swaps (OIS) market is pricing the Fed to hike the Fed Funds Rate (FFR) to just over 500 bps by the June 2023 FOMC meeting, then cut it by roughly 25 bps by the November meeting.
Phase 2: Economic Contraction | 2H22 to 1Q24
Pinning down a recession start date is best left to the NBER business cycle authorities, but broadly speaking the weight of the economic and market evidence suggests the US economy entered the contraction phase sometime in the 2H of 2022. It is difficult to guess with precision how long a contraction will last, but very loosely...the fact the OIS market has Fed cutting interest rates in the 2H of 2023 says the economy has a decent chance of bottoming out sometime in the first quarter of 2024.
Phase 3: Financial Market Normalization & Economic Recovery | 2H23 to 2024
Assuming the Fed follows current OIS pricing, once it pauses rate hikes at the June 2023 FOMC meeting interest rates should begin to normalize early in the second half of 2023, as indicated by a steepening of the yield curve. Once it begins cutting interest rates in 4Q23, the S&P 500 should find its ultimate bottom ahead of an economic bottom in 1Q24, and the yield curve should continue to steepen.
If the Fed is successful in bringing CPI inflation down to an average of 3% YoY over the course of 2024, alongside a recovery in financial markets and the economy the US Treasury (UST) curve should normalize to its long-term average state by the end of 2024 - that is: a 2% real 10-year yield and a 91 bps nominal 10y-2y curve. Assuming 3% inflation, by the end of 2024 a "normal" state of the UST curve would be a 5% 10-year and a 4.09% 2-year.
For the S&P 500, "normal" by the end of 2024 would be a 17.5x P/E multiple applied to earnings generated from a 9.4% net profit margin (NPM). One could argue a normalized NPM for SPX is much lower than 9.4%, but giving SPX the benefit of the doubt for the very real long-term increase in overall business quality, assuming normalized NPM is the average of peak NPMs generated in 2007 (8.6%) and 2019 (10.2%) seems reasonable. At present, Wall Street estimates SPX will generate sales per share of $1873.10 in 2024, which implies "normalized" EPS of $176. Applying the long-term historical average P/E of 17.5x to $176 yields an SPX fair value of 3080 by the end of 2024.
Three critical assumptions, discussed at length in the following section, underpin this projected normalization process: 1) inflation is entrenched, and will require a recession, with tight monetary policy maintained throughout, to uproot it; 2) Fed Chair Jerome Powell understands what it will take to uproot inflation; and 3) Powell has the resolve to do what it takes to uproot inflation.
War on Inflation
Inflation is entrenched, and will require a recession, with tight monetary policy maintained throughout, to uproot it.
Since the "transitory inflation" debate broke out in the middle of 2021, Ray Dalio's Bridgewater (BW) and its deep understanding of the inner workings of the "economic machine" has been mission critical to understanding how persistent inflation really is and just how much the Fed would need to tighten monetary policy to uproot it. A single passage does not do justice to the entire body of BW's work on inflation, but one of the more succinct overviews comes from BW's July 25, 2022 CIO update:
"MP3 reflationary policies [see the BW 2022 Outlook attached for a detailed discussion of MP3 policies] injected massive amounts of money and credit into economies, leading to self-reinforcing high nominal growth, leading to self-reinforcing inflation..."
"MP3 policies were very successful, stimulating a high level of nominal demand and a rapid recovery in employment markets in response to the pandemic. But this stimulation was applied for too long, and the offsetting monetary tightening is now coming too late, resulting in what we now have, which is a monetary inflation. Given the inertia of a monetary inflation, bringing it under control to the point that inflation approaches what is now discounted in the markets (2.5%) will require an aggressive tightening of monetary policy over a sustained period, and a significant and sustained weakening of employment markets."
BW's track record of being right on inflation for the right reasons makes them the leading authority on the issue. As such, odds are very high that inflation is entrenched, and will require a recession, with tight monetary policy maintained throughout, to uproot it.
Fed Chair Jerome Powell understands what it will take to uproot inflation.
All year long former NY Fed President Bill Dudley has spoken on behalf of and ahead of official Fed communication. In a July 14 Bloomberg op-ed (see attached) he all but wrote from the BW script:
"...the Fed needs to be confident that it has succeeded in pushing inflation back down on a sustainable basis. Chair Powell correctly understands that the costs of not hitting the 2% target over the next year or two outweigh the costs of a mild recession - because failure would cause inflation expectations to rise, necessitating an even tighter monetary policy and a deeper downturn later. In the late 1960s and the 1970s, the central bank tightened monetary policy enough to push inflation lower at times, but it reversed course too soon. As a result, the peaks and troughs for inflation kept moving higher - until the 1980s, when Paul Volcker had to force a deep recession to regain control. Given this history, officials will be hesitant to stop tightening until they're highly confident (probability greater than 80%) that they've done enough - that the labor market has sufficient slack to keep inflation low and stable, and that easing financial conditions won't lead to an inflation rebound."
Powell repeated Dudley's prophetic op-ed almost verbatim in his August 26 speech at Jackson Hole:
"...we must keep at it until the job is done. History shows that the employment costs of bringing down inflation are likely to increase with delay, as high inflation becomes more entrenched in wage and price setting. The successful Volcker disinflation in the early 1980s followed multiple failed attempts to lower inflation over the previous 15 years. A lengthy period of very restrictive monetary policy was ultimately needed to stem the high inflation and start the process of getting inflation down to the low and stable levels that were the norm until the spring of last year. Our aim is to avoid that outcome by acting with resolve now.
"These lessons are guiding us as we use our tools to bring inflation down...We will keep at it until we are confident the job is done."
When CPI inflation broke out to current levels in the late 1960s, it took almost three decades, multiple recessions, and multiple Fed chairs to bring it back down to 2-3% for good. Powell knows this treacherous history of the Great Inflation period, and based on the above it is clear that he knows exactly what it will take to avoid its redux.
Powell has the resolve to do what it takes to uproot inflation.
The principal monetary policy error that underpinned the Great Inflation period of the late 1960s to early 1980s was what policymakers call "stop and go" monetary policy. As Dudley outlined in the quote above, the Fed tightened monetary policy enough to push inflation down, but then reversed course once the labor market weakened, allowing inflation to reaccelerate. The Powell Fed has made it abundantly clear it will not repeat this mistake, most emphatically so by Powell himself at Jackson Hole on August 26:
"Restoring price stability will likely require maintaining a restrictive policy stance for some time. The historical record cautions strongly against prematurely loosening policy."
And perhaps most definitively with his answer to the final question of the September 21 press conference:
"And let me say, we've written down what we think is a plausible path for the federal funds rate. The path that we actually execute will be enough. It will be enough to restore price stability."
With his legacy hanging in the balance (will he be Burns or Volcker?), there is little to no question that Powell will do whatever it takes to uproot inflation. But he still needs to prove it with action (believe it or not).
Despite overseeing one of the most aggressive rate hike campaigns in US history over the course of 2022, financial market participants still do not believe Powell has the resolve to take the economy into recession and maintain tight monetary policy throughout. Over the course of 2022, any whiff of the Fed backing off and/or inflation data improvement has led to a counter-productive easing of financial conditions (via higher stock prices and lower interest rates) because investors believe Powell's Volcker-like rhetoric is simply a jaw-boning exercise until inflation begins to decelerate. Volumes of evidence of the widespread disbelief in Powell's resolve can be produced, but a recent example stands out.
In a November 8 Bloomberg op-ed (see attached) a prominent member of "Team Transitory", Conor Sen, said:
"Markets are now priced for the Fed Funds rate to rise closer to 5%. Despite that, there's now a view that the higher level would still be consistent with a soft landing in the economy, and stocks would probably rally if cooling inflation allowed the Fed to pause at 5%."
Sen's analysis represents well the widespread belief that the Fed is still attempting to achieve a soft landing, a belief that by definition calls into question Powell's resolve to take the economy into recession (aka a "hard landing"), let alone his resolve to maintain tight monetary policy throughout the recession. This is a dangerous game of "fight the Fed" investors have played all year, raising the rate hike bar Powell needs to clear to sufficiently tighten financial conditions, which in turn has raised the risk of a "crash landing".
Maintaining tight monetary policy throughout a recession is a battle for the second half of next year. First, Powell needs to take the economy into recession, which the body of Fed communication since mid-October suggests he is eminently prepared to do. Let's start with Minneapolis Fed President Neel Kashkari. On October 18 he said:
"The 1970s was a period of very high inflation. The FED Chairman Paul Volcker said 'I've got to break the back of inflation,' and they raised rates aggressively, leading to a very deep recession. The good news is, that recession was very short-lived. And when there are recessions that are traditionally triggered by tight monetary policy to crush inflation, the recovery can be very quick from there. And the important thing is, I believe, it benefited the American economy for decades by getting inflation expectations anchored and getting inflation bottled up. And so that to me is what's at stake. What's at stake is giving up this economic backdrop that we've all enjoyed...for decades. And we need to preserve that."
And the next day, October 19, he followed up with:
"If you look at the recessions that have taken place in the past that were induced by the Federal Reserve - the biggest being in 1981 by Paul Volcker. Those recoveries can be very fast. So those do not suggest an '08-type recovery where it takes 10 years. Those bounce-backs can be very, very quick. You get inflation down, then you normalize monetary policy, and then the economy can boom again. There's a lot of uncertainty, and the lags make this very complicated. But the cost of not tackling inflation, in my mind, is an unacceptable cost."
Look for Kashkari's line of thinking to become central to Fed communication strategy in the wake of Powell's speech on November 30, along lines of: "We need a downturn to kill inflation, but history suggests it will be quick and will set the economy up for well-balanced growth over the long-term."
Fast forward to November 15, Dudley penned one of his longer Bloomberg op-eds (see attached) this year detailing the "inevitability" of recession:
"Why do I believe a recession is unavoidable? To start, the Fed is committed to bringing inflation down to its 2% annual rate target. Powell made it clear in his remarks at the Jackson Hole conference in August that this goal was 'unconditional.'"
"To bring inflation down to 2%, the Federal Open Market Committee will have to push up the unemployment rate substantially [to 4.5-5% from 3.7% currently]. The labor market is much too tight to be consistent with a stable or declining underlying inflation rate."
"During the postwar period, every time the unemployment rate has risen by 0.5 percentage point or more, the US economy has fallen into recession. The difficulty of engineering a soft landing is underscored by the fact that there are no examples of an unemployment rate rising between 0.5 and 2 percentage points from trough to peak at all. Once the unemployment rate has moved up modestly, it's hard to stop."
"...the Fed's task will be made difficult by uncertainty about whether it has done enough. How high do short-term interest rates need to go to push the unemployment rate above the rate consistent with stable inflation? How long does such an unemployment rate need to be elevated to bring inflation back down to 2%? Because, at the margin, the negative consequences of doing too little exceed the negative consequences of doing too much, this means that monetary policy will likely ultimately be kept too tight for too long."
The day after Dudley, November 16, came Kansas City Fed President Esther George:
"I’m looking at a labor market that is so tight, I don’t know how you continue to bring this level of inflation down without having some real slowing, and maybe we even have contraction in the economy to get there."
Then lastly, on November 23 the FOMC November meeting minutes detailing how the Fed's staff of economists project the risk of recession "as almost as likely as the baseline" scenario:
"The staff...continued to judge that the risks to the baseline projection for real activity were skewed to the downside and viewed the possibility that the economy would enter a recession sometime over the next year as almost as likely as the baseline."
Don't fight the Fed: recession is upon us.
A quick P.S. on the "War on Inflation" section. As you can see at the top of this write-up, its construction started back on November 22. The War on Inflation section was completed on November 27, and the next day, November 28, NY Fed President John Williams gave a speech forecasting a "hard landing" (see attached):
"...the pain is not felt equally. The data show that those who can least afford the rise in costs for food, housing, and transportation suffer the most.3 The priority for monetary policy is clear. The Federal Reserve is strongly committed to bringing inflation back down to its 2 percent longer-run goal."
"The labor market remains remarkably tight: Hiring is robust, and we still are seeing rapid wage gains. But with growth slowing, I anticipate that the unemployment rate will climb from its current level of 3.7 percent to between 4-1/2 and 5 percent by the end of next year."
May the "soft landing" R.I.P.
S&P 500 Outlook
The fact a US economic contraction over the next 12-18 months is the high probability base case scenario aids the job of constructing an outlook for the S&P 500, as it allows the analysis to be narrowed down to SPX performance around the 15 NBER-defined recessions since 1929. At the very highest level of analysis, using a trimmed mean methodology (excluding the 3 best and 3 worst cases) the average SPX decline is -31% with a range of -15% to -51%. From its January 4, 2022 all-time high of 4818.62, a -31% decline would put the ultimate bottom at around SPX 3325, with a possible range of 2361 (-51%) to 4096 (-15%).
The next level of analysis is to look at trough valuation. Using the same trimmed mean methodology as detailed above, the average SPX trough P/E (price/prior peak LTM EPS) is 9.4x with a range of 6.7x to 13.8x. If peak LTM EPS settles out at around $210 (versus $207 currently), the historical average trough P/E would put the ultimate low at around SPX 1974, with a possible range of 1407 (6.7x) to 2898 (13.8x).
Lastly, and most importantly, is macro regime analysis, which looks for the most relevant historical analogs to today's market environment. To frame the discussion, here is how the 15 NBER-defined recessions since 1929 can be very loosely broken down:
Great Depression: 1929, 1937
World War 2: 1945, 1948
Postwar Boom: 1953, 1957, 1960
Great Inflation: 1969, 1973, 1980, 1981
Great Moderation: 1990, 2001, 2007, 2020
Some folks have described this post-pandemic environment as akin to the World World 2 regime, where inflation was high as result of severe supply-side disruptions but normalized once the economy restructured out of its war-time configuration. It is an appealing analog given the similar quasi-artificial economic distortions of a war and a pandemic, but SPX bottomed at such a low multiple (5.6x) in the 1948 recession that it is very difficult to use it as a frame for today's high-P/E environment. (At the October 13, 2022 SPX low of circa 3490, SPX traded at around 17x prior peak LTM EPS.) Further, the scale of the economic distortions as a result of the COVID pandemic likely pales in comparison to the economic reconfiguration required to fight a multi-year, multi-theater world war; and as the Bridgewater inflation analysis demonstrates, the current high inflation regime is overwhelmingly due to excess demand.
Given the demand-driven nature of today's inflation, the current market environment is likely better framed, at least in part, by the early stages of the Great Inflation regime, specifically the 1969 recession and attendant SPX bear market. In 1969, YoY Core CPI inflation broke out above the 6% level the US economy is struggling with today. The Fed wrestled it back down to 2.5% by 1972-1973, but because it let up to protect the labor market, Core CPI inflation reaccelerated to a fresh high of almost 12% in 1975.
In May 1970, SPX made its bear market low at a P/E of 11.8x prior peak LTM EPS alongside a 10-year US Treasury yield of 8.2%. At first glance this is a poor analog for today's market because the 10-year is currently under 4%. At the 1970 SPX trough the "earnings yield - 10y" spread was just 27 basis points, which, assuming the 10-year settles out at 3.5%, would put the equivalent SPX level today at almost 5500 ($207 EPS / 3.77% earnings yield). But fast forward to October 1974 - the second of four recessions in the Great Inflation period - when SPX troughed at 6.8x with the 10-year at 8.04%, and the picture changes entirely. The 1974 "earnings yield - 10y" spread was 6.67%, which would imply an SPX level of 2035 today assuming a 3.5% 10-year ($207 / 10.17%).
Long story short, despite the difference in interest rates, the May 1970 trough SPX P/E of 11.8x appears to be a reasonable valuation yardstick for today's high inflation environment. Assuming peak LTM EPS settles out at around $210, 11.8x would put the ultimate SPX low at around 2478.
Perhaps the best middle ground macro regime framework is the grinding 2000-2002 bear market that was kicked off by FED raising rates into a large-scale equity bubble and ended with SPX trading at 14.3x with the 10-year at 3.66%. At 14.3 times $210 peak LTM EPS, SPX would trough at around 3003.
Adding it all up, we get the following range of probable outcomes assuming the US economy goes into or is already in recession:
SPX 3325: -31% decline, the average experience around NBER-defined recessions since 1929
SPX 3003: 14.3x peak LTM EPS, the trough P/E at the October 2002 low with the 10-year at 3.66%
SPX 2478: 11.8x peak LTM EPS, the trough P/E at the May 1970 low with the 10-year at 8.2%
SPX 1974: 9.4x peak LTM EPS, the average trough P/E around NBER-defined recessions since 1929
From a valuation and macro regime perspective, the core of the distribution (2500-3000) looks like a very interesting zone for a durable bottom. But we won't know until we get there. If SPX falls into that zone with the US Treasury (UST) curve still deeply inverted, and FED does not quickly back off, then it's likely SPX will fall out of the bottom of the zone. Conversely, if the UST curve moves close to parity if not out of inversion (an indication that Fed policy is becoming easier at the margin) prior to SPX falling into the zone, then there is a chance the ultimate low for this bear market will end up closer to the top of the distribution (SPX 3325).
The yield curve is key for identifying the possibility SPX has entered a bottoming process. The most commonly cited US Treasury yield curve is the "10-year minus 2-year" (10y-2y), but because the 3-year has a longer trading history than the 2-year, the 10y-3y curve is preferred for macro regime analysis. Further, by looking at the curve from a 3y/10y perspective the analysis is normalized for the prevailing level of interest rates. For example: Intra-day on November 29, the 3-year is trading at a 13.7% premium to the 10-year (4.23% / 3.72%), the highest degree of inversion on record going back to the late 1960s; but if the 3-year is simply subtracted from the 10-year, the scale of inversion (-51 bps) is dwarfed by the high interest rate environment of the Great Inflation period that saw the 10y-3y curve fall as low as -157 bps.
It is commonly understood that the yield curve exits inversion as the economy moves into recession (i.e. it's positively sloped) and then is very steep by the time the equity market bottoms in the latter stages of the recession. While that was the case for the four recessions in the Great Moderation regime (1990, 2001, 2007, 2020), it was not the case during the Great Inflation (1969, 1973, 1980, 1981). The dataset below looks at the 3y/10y curve at the start of the NBER-defined recession and at the SPX low:
Great Inflation
1969: 105% at recession start and 99% at SPX low
1973: 101% and 102%
1980: 103% and 110%
1981: 105% and 97%
Average: 104% and 102%
Great Moderation
1990: 98% and 92%
2001: 94% and 55%
2007: 76% and 47%
2020: 86% and 43%
Average: 89% and 59%
Navigating the bottoming process in this bear market is going to be tricky. If the high probability historical analog was the 1969 recession in the very early stages of the Great Inflation, then the analysis would be relatively straight forward: once the 3s/10s curve approaches parity, there is a high probability an SPX low is close at hand. The problem is the low level of interest rates today suggests this market environment might be more akin to the 2000-2002 bear market when SPX bottomed with the 3y/10y curve at a very steep 55%. The only answer at this juncture is to plan to move into high alert that a bottoming process is underway once the 3y/10y curve moves closer to parity.
The ultimate low for this bear market will not be confirmed until a powerful set of "breadth thrust" signals fires with Fed policy clearly at the economy and market's back. That may come with the 3y/10y curve at 100% or 50% - we won't know until we get there.
What's critical to remember from a "return to normal" perspective is that a bullish Fed posture is likely to look dramatically different than it did over the last 10-20 years. If the Fed follows market pricing and hikes the Fed Funds Rate (FFR) up to say 500 bps, it will likely only cut to 400 once it's clear inflation is fully contained. At a 400 FFR with 3% average headline CPI, the real FFR would be circa 100 bps, a level the Fed will likely want to maintain as an insurance policy against a surprise reemergence of inflation in the next economic recovery.
Right Tail Risk
With apologies to the statistical purists, the distribution of projected SPX levels assuming the US economy is already in or will enter recession (3325, 3003, 2478, 1974) is best viewed as the "95% area" under a bell curve. And while it may appear odd that with the S&P 500 currently trading around 4000 there is not a 95% scenario that has SPX higher than 4000, when a "weight of the evidence" approach is employed, the projected outcomes fall where they fall.
Today's market environment is not unlike late 2020, but in reverse. In late 2020 the outlook for 2021 was a one-way street higher with the Fed conducting a $120 billion/month QE program into a fiscal stimulus-fueled economic boom - the only sensible "bear case" scenario in the 95% area of the curve was for a slightly less positive return than the double-digit base case. The scenario in which SPX was projected to fall was a true "2.5% left tail" scenario that one needed to think outside the box to construct.
Today, the outlook for 2023 is a one-way street lower with the Fed aggressively tightening monetary policy into a recession with the stock market coming off one of the largest valuation bubbles in history. The only sensible "bull case" scenario in the 95% area of the curve is for a slightly less negative return: SPX 3325 at the top-end versus the 2478 to 3003 core of the distribution.
The "right tail" risk to the SPX outlook is not the consensus bull case outlined by Conor Sen earlier in this write-up - that is: inflation falls quickly back to the Fed's 2% target without a recession, paving the way for stocks to rally on the Fed pausing rate hikes at 5%. If inflation falls as quickly as Team Transitory believes it can, then Fed policy will be way too tight after a 50 bps hike in December to 425 bps. If CPI inflation averages 2% over the course of 2023, then the real Fed Funds Rate in December will be 225 bps, far too tight in the early stages of an economic contraction with inflation at the Fed's target.
The true "right tail" risk to the SPX outlook is the Fed repeating the "stop and go" monetary policy mistake of the Great Inflation regime. Very simply, if the Powell Fed backs off before the economy contracts enough to kill inflation, there will likely be an explosive rally from current levels, perhaps back to the 4818.62 ATH by the end of 2023. This is why a laser-like focus on Fed communication is so critical to constructing an outlook and positioning for the likely path of the S&P 500.
While the path down to the core of the SPX outlook distribution (2478 to 3003) will likely continue to be saw-toothed, as long as Fed Chair Jerome Powell's legacy is on the line (will he be Burns or Volcker?) it is best to look down not up as we head into 2023.
EXHIBITS & ANALYSIS
Inflation is Entrenched
Core CPI broke out to current levels (6%+) in the late 1960s and the Fed was able to wrestle it back down to the 2-3% level by taking the US economy into recession. But it backed off to protect the labor market, which allowed inflation to reaccelerate in the next economic upswing - the first of many "stop and go" policy mistakes in the Great Inflation period. It then took until the mid-1990s for Core CPI to return to 2-3% on a sustained basis.

Fed Chair Powell knows this treacherous history of the Great Inflation all too well, and the fact inflation is not just high, but also broad, and has made its way into wages means he must not repeat the "stop and go" mistake with his legacy on the line.


The OIS market has the FFR at just over 500 bps by June 2023 before falling to 480 in November.
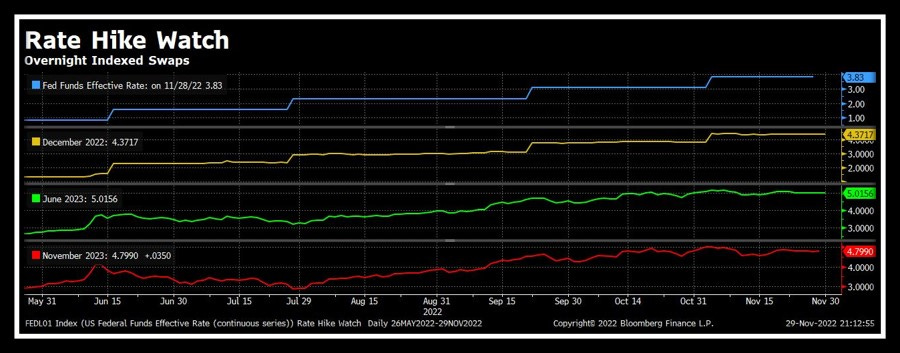
Conor Sen of Team Transitory believes this is an inflation "burp".

Don't Fight the Fed: Recession is Upon Us
In addition to decisive YTD outperformance by traditional defensive sectors (Staples, Utilities, Healthcare) and the high and rising cost of credit default swap protection, the fact consumer confidence has never been this low outside of recession says the US economy likely began contracting in the second half of 2022.

Global recession risk has been high all year...

...And now US recession risk is starting to move (this was a very late signal in 2008).

S&P 500 Outlook
Average decline in NBER-defined recession is -31%. Average trough P/E is 9.4x.

On average, the SPX NPM falls -41% (from the prior high) in recession. If this -41% contraction is applied to the 12.9% NPM peak in January of this year, that implies a NPM of circa 7.6% in 2023. If 7.6% is applied to the current "Street" estimate for 2023 sales per share ($1791.60), 2023 SPX EPS would be $136 versus the current Street estimate of $234.71. The vulnerability of SPX's NPM is one of if not the biggest risk hiding in plain sight, not just for this bear market cycle but looking out 5-10+ years.


The 3y/10y US Treasury curve will be the guide for identifying a possible zone for a durable bottom.

The Return to Normal
Long-term average "real" 10-year US Treasury yield: 2%.

Long-term average 10y-2y curve: 91 bps.

Long-term average SPX P/E: 17.5x.
