SPX Market Outlook: December 1, 2020
Rationally Exuberant Through 2023 (At Least). Don't Get Bearish Until the Fed Pulls Back
***PLEASE NOTE THIS IS FROM DECEMBER 2020***
I am in the process of constructing an SPX Market Outlook piece that will refer back to this outlook write-up that was done prior to The WOTE in another forum.
EXECUTIVE SUMMARY
Near-Term Outlook. Stock market leading indicators point to more than 10% upside (price-only) for the S&P 500 over the next 12 months (versus the 8.5% historical average). But, with a likely acceleration in the economic recovery and extremely aggressive Fed policy in place, "risks" are skewed heavily to the upside.
US Economy. The prospect of a widely available set of vaccines by mid-2021, the vaccine deployment itself, and a decline in economic policy uncertainty should combine to accelerate the economic recovery. Wall Street analysts are notorious for following, not leading, the fundamentals - so, as the economy accelerates so too should "Street" estimates of S&P 500 earnings. This early in the recovery the market should respond favorably to an acceleration in estimates.
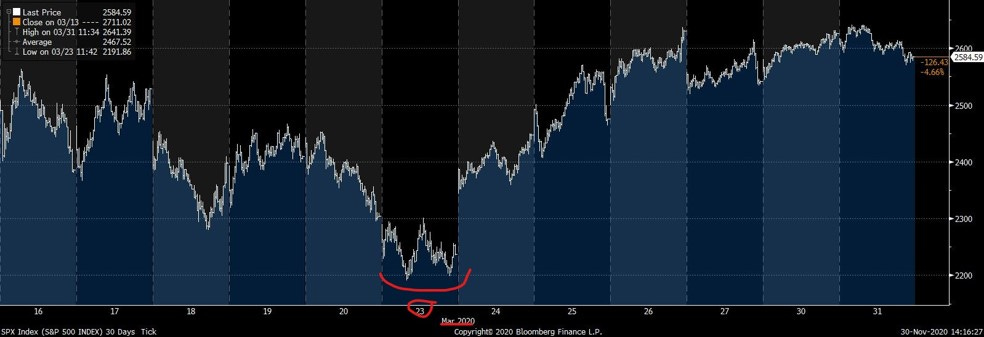
Federal Reserve. The S&P 500 bottomed on March 23, the day the Federal Reserve announced its open-ended money printing program (i.e. quantitative easing, or, “QE”). Subsequent Fed commentary suggests this open-ended QE program will not end until 2024 at the very earliest, creating a highly favorable risk/reward profile for the S&P 500 through 2023.
Long-Term Outlook. Looking out over the next 10 to 20 years, the industry standard "expected return" model (i.e. the "Schiller Model") projects the S&P 500 will generate a total return of just 2-5% per annum. The Schiller Model relies heavily on the assumption that both the S&P 500's net profit margin and P/E ratio will fall over time. Interest rates are very likely to rise from here and that certainly could weigh on P/E ratios; but if rising rates are accompanied by higher real economic growth, profit margins could remain where they are, thus muting the impact of a lower P/E. For the Schiller Model to be correct, a macroeconomic catalyst is required to drive inflation and interest rates higher without a concurrent rise in real economic growth. Runaway deficit spending could be a catalyst, but time will tell.
Deficit Spending. The resounding success of large-scale deficit spending jumpstarting the economy out of its COVID coma could act as a green light to policymakers to maintain outsized fiscal deficits long into the future. The potential consequences of runaway deficit spending, both good and bad, are vast, and investors need to keep an open mind.
NEAR-TERM OUTLOOK
Stock market leading indicators point to more than 10% upside (price-only) for the S&P 500 over the next 12 months (versus the 8.5% historical average). But, with a likely acceleration in the economic recovery and extremely aggressive Fed policy in place, "risks" are skewed heavily to the upside.
Historically, the most reliable leading indicator for the stock market is what is known as a "breadth thrust". Basically, a breadth thrust is generated when a lot of stocks go up a lot in a short period of time. Picture a rocket ship at launch: There is a large surge of initial energy that "thrusts" the rocket very far and very quickly, but with the bulk of the rocket's journey yet to come. So, for the stock market, a breadth thrust signals that the market has been effectively "launched" into a rally that will take it far higher over the ensuing months.
The most effective use of the wide variety of breadth thrust indicators is to look at them as a group. When you get multiple signals in a short period of time that is a very bullish dynamic that points firmly to above-average gains for the stock market over the next 12 months. What makes the current market set-up especially bullish is that there have been two distinct clusters of signals since the S&P 500 bottomed on March 23. Going back to the rocket ship analogy, in effect the "rocket" experienced a second "thrust" mid-flight - an historically rare and exceedingly bullish development.
Breadth Thrust Signal Cluster #1
March 26 | % of stocks above their 10-day moving average
April 9 | % of stocks above their 10-day moving average
April 27 | % of stocks at 30-day highs
May 26 | % of stocks above their 50-day moving average
June 3 | % of stocks at 20-day highs
June 5 | 10-day advancing stocks/declining stocks
June 8 | 10-day advancing volume/declining volume
Breadth Thrust Signal Cluster #2
October 7 | 10-day advancing stocks/declining stocks
October 8 | 10-day advancing volume/declining volume
October 8 | % of stocks above their 10-day moving average
November 9 | % of stocks at 20-day highs
One of the more powerful breadth thrust indicators is the ratio of advancing stocks/declining stocks over a 10-day period (see the 10/7 blue highlight above and image below). (For reference, the cumulative version of this indicator is known as the "advance/decline line".) A breadth thrust signal is triggered when this ratio rises above 1.9, after which the S&P 500 has historically returned 17.43% (price-only) over the next 12 months (252 trading days = 12 calendar months). The day of the latest signal (10/7/20) the S&P 500 closed at 3419, which implies it would need to rise to 4015 by October 2021 if it were to follow historical precedent, or 10.4% from last close (3638 on 11/27/20).
Confirming the 10/7/20 advance/decline signal is the % of stocks at 20-day highs. On 11/9/20 more than 60% of S&P 500 constituents traded at a 20-day high, a signal historically followed by a 15% price-only return over the next 12 months, implying 12.2% upside for the S&P 500 from last close.
10-12% upside for the S&P 500 over the next 12 months is a conservative base-case scenario, as two major clusters of breadth thrust signals likely point to a much larger move driven by a combination of an acceleration in the economic recovery and extremely aggressive Fed policy.
US ECONOMY
The prospect of a widely available set of vaccines by mid-2021, the vaccine deployment itself, and a decline in economic policy uncertainty should combine to accelerate the economic recovery. Wall Street analysts are notorious for following, not leading, the fundamentals - so, as the economy accelerates so too should "Street" estimates of S&P 500 earnings. This early in the recovery the market should respond favorably to an acceleration in estimates.
Economic Recovery
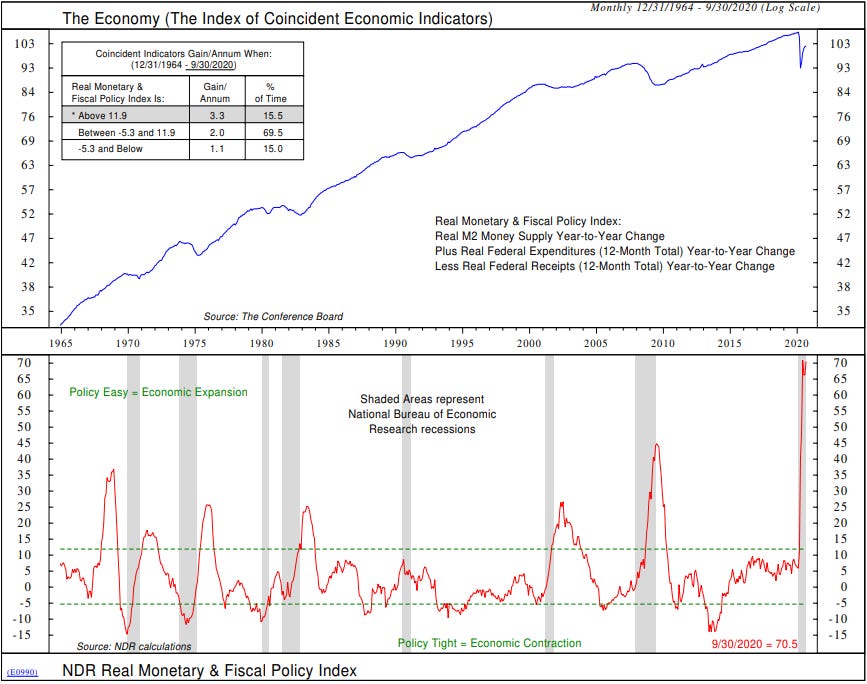
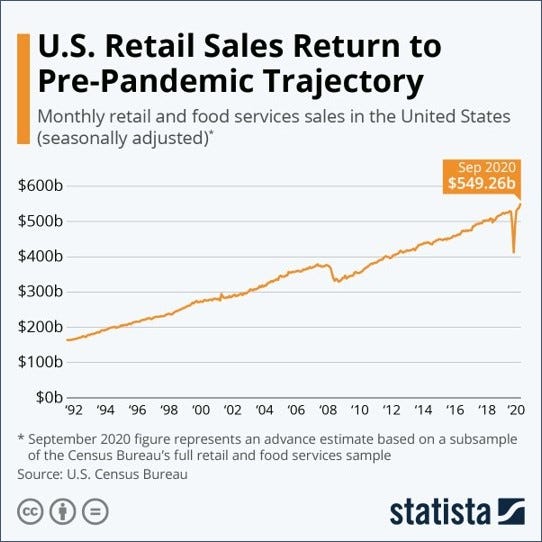
Due to the shelter-in-place lockdown order in response to COVID-19, US nominal GDP (on a seasonally adjusted annualized basis) fell from its all-time high of $21.8 trillion in the 4th quarter of 2019 to $19.5 trillion in the 2nd quarter of 2020 (see first image below). At its 2nd quarter trough, GDP was 90.6% of its prior high, well below the 96.7% trough of the last recession (2Q09), demonstrating just how severe of an economic shock this crisis was. The combination of the self-induced nature of the shutdown (essentially the economy was turned off and then back on in the span of 4-8 weeks) and truly awe-inspiring levels of fiscal and monetary stimulus (see second image below), the economy snapped back very quickly in the 3rd quarter to $21.2 trillion, or 97.3% of the former high. Perhaps the best illustration of the highly unusual nature of the COVID crisis is the fact US retail sales are already tracking above their pre-COVID highs (see third image below), a feat that took more than four years coming out of the 2008 financial crisis. The snapback in retail sales makes sense in light of the fact that personal income actually rose through the recession (see fourth image below).
COVID-19 Vaccine
Based on current estimates for COVID-19 vaccine production (see first image below) the world could effectively take a vaccine "bath" in 2021. There are certainly questions around uptake (see second image below), but given the low fatality rate of COVID-19 (we don't need 100% inoculation to fully restore economic confidence) and the highly contagious nature of the virus (the world is likely more organically immune than current reporting suggests), even a modest uptake should be enough to fully restore economic activity by the second half of 2021. In the meantime, the mere prospect of widespread vaccine availability should start to bolster corporate, consumer and investor confidence.
The Dallas Fed National Mobility and Engagement Index (first image below) - down almost -40% year-over-year at last reading - and OpenTable's global walk-in/reservation data (second image below) - down over -40% year-over-year at last reading - represent well the economic restoration potential once the world returns to normal. Of course, there will be puts and takes to the recovery, as there is a good chance a large portion of the accelerated shift to online/mobile/at-home activity will "stick". But the fact remains, COVID fatigue is very real and there is going to be sizeable release of pent-up demand for pre-COVID activities.
Policy Uncertainty
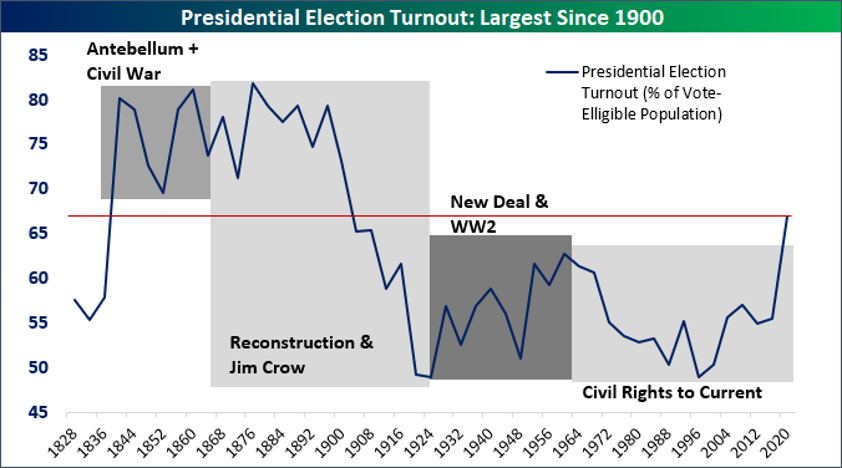
If the GOP retains its Senate majority (which at last reading it was favored to do) it would be just the third D White House/D House/R Senate combination in US history (see first image below). As the outcome of the highest-turnout election since 1900 (see second image below), this combination is a resounding mandate for both parties to return to moderation. With Donald Trump's market-moving tweets out of the way (he's tweeted over 200 times about the stock market since taking office), and the vast majority of the Trump administration's business-friendly tax and regulatory cuts preserved via a GOP Senate majority, a return to moderation in D.C. would dramatically reduce economic policy uncertainty (see third image below), further bolstering corporate, consumer and investor confidence.
S&P 500 Earnings
Given that the economy and corporate earnings power will be in recovery mode through the first half of 2021, Wall Street's projection for 2022 S&P 500 EPS is likely to be a "fulcrum" estimate that market participants use to gauge the size and speed of the recovery over the course of the next 12 months. Wall Street currently projects that the S&P 500 will earn $198 per share in 2022 (see image below), down -6% from where it was at the start of 2020 but up just 7% from its nadir in June. If the economic acceleration thesis outlined above is correct, as mid-2021 approaches, this 2022 estimate is likely to approach its high-water mark of $215 set in early 2020.
The S&P 500 last closed (3638 on 11/27/20) at 16.9 times the $215 high-water mark, which works out to an earnings yield of 6%. As long as the 10-year US Treasury yield stays in the 1% range, market participants are likely to view a 6% earnings yield as cheap relative to the risk-free alternative. As such, it is not difficult to envision a path to a much higher level in the S&P 500 as long as interest rates remain contained - for instance, at 4500 the S&P 500 would have a 4.8% earnings yield, a still-reasonable 4% cushion over a 1% 10-year Treasury yield.
FEDERAL RESERVE
The S&P 500 bottomed on March 23, the day the Federal Reserve announced its open-ended money printing program (i.e. quantitative easing, or, “QE”). Subsequent Fed commentary suggests this open-ended QE program will not end until 2024 at the very earliest, creating a highly favorable risk/reward profile for the S&P 500 through 2023.
"Whatever it takes"
On July 26, 2012, European Central Bank (ECB) president Mario Draghi declared that he would do "whatever it takes to preserve the Euro," immediately followed up with "And believe me it will be enough." Perhaps the most important statement in central banking history, not only for the problem it solved at the time but the precedent it set by making the implicit central bank "put" forcefully explicit.
Draghi's statement almost instantaneously halted the European debt crisis that had been plaguing global stock and bond markets since mid-2011. But it was exactly that: a statement. The ECB's balance sheet went on to decline from 30% of GDP at the time of the statement to 20% just prior to the launch of a large-scale QE program in 2015 (see first image below)…yet the Italian 10-year government yield fell from 6% to 1% over that time (see second image below). In the case of central bankers, watch what they say, not just what they do.
"Whatever it takes" x 2
Federal Reserve Chair Jerome Powell learns quickly. On October 3, 2018 he singlehandedly kicked off a bear market in the S&P 500 by stating that the Fed Funds Rate was a "long way" from neutral (see first red circle in the image below at SPX 2940), implying the Fed was on rate hike autopilot. With the S&P 500 down -20% by late December (see second red circle in the image below at SPX 2350), Powell promptly pivoted. But that was just the warmup.
Fast forward to March 23, 2020, Powell's Federal Reserve announced and launched a QE program of unspecified size and duration, the first open-ended money-printing program in post-gold standard US history: Powell's first of "whatever it takes" moment. Logically, the S&P 500 bottomed on March 23.
On May 15 the S&P 500 closed 31% above its intra-day March 23 low. An impressive recovery, no question, but the path was quite volatile, as the Index careened between negative COVID headlines and bullish re-opening/vaccine news. By the week of May 15 Jerome Powell had had enough of the volatility. In a 60 Minutes interview that aired on Sunday, May 17, Powell had the following exchange with host Scott Pelley (lightly edited for readability):
Scott Pelley: "Fair to say you simply flooded the system with money?"
Jerome Powell: "Yes. We did. That's another way to think about it."
Scott Pelley: "Where does it come from? Do you just print it?"
Jerome Powell: "We print it digitally. So as a central bank, we have the ability to create money digitally and we do that by buying Treasury Bills or bonds or other government guaranteed securities and that actually increases the money supply."
This was Powell's "And believe me, it will be enough" follow-up. Logically, the S&P 500 never looked back - gapping higher Monday morning (5/18), and yet to return to its 5/15 closing price of 2864 (will it ever?).
Powell's second "whatever it takes" moment was more subtle than the first, but perhaps even more impactful from a long-term perspective. In a June 3 post-FOMC meeting press conference with the financial press corps, Powell said that prior to COVID the Fed had failed to reach its inflation target of 2% even with the unemployment rate at 3.5%. In other words, the Fed believes the economy can handle virtually an unlimited amount of monetary stimulus as long as the economy is running at less than full capacity. In other words, the Fed is going to do whatever it takes to boost inflation.
According to the Fed's June 2020 Monetary Policy Report, the FOMC's median projection is for the unemployment rate to exit 2022 at 5.5% before eventually falling to a "longer run" rate of 4.1%. "Eventually" is the operative word - it took the economy almost five years to go from 5.5% unemployment in May 2015 to 3.5% in January 2020 (see image below). If it takes the economy two years beyond 2022 to reach 4.1%, that means the Fed will be running open-ended QE at least through 2024. Financial market participants need to buckle up, as there is a very plausible path to a truly historic stock market bubble in the coming years.
Consider this: At its 1999 valuation peak, the S&P 500 traded for 44 times normalized earnings (i.e. "Schiller EPS")…with the 10-year US Treasury bond yield at 6.3%!!! Current Schiller EPS is $109, and 44 times that is 4800 on the S&P 500. An even bigger valuation bubble in today's monetary policy environment is entirely possible, perhaps 50-60 times Schiller EPS, or 5500 to 6500 on the S&P 500 today.
LONG-TERM OUTLOOK
Looking out over the next 10 to 20 years, the industry standard "expected return" model (i.e. the "Schiller Model") projects the S&P 500 will generate a total return of just 2-5% per annum. The Schiller Model relies heavily on the assumption that both the S&P 500's net profit margin and P/E ratio will fall over time. Interest rates are very likely to rise from here and that certainly could weigh on P/E ratios; but if rising rates are accompanied by higher real economic growth, profit margins could remain where they are, thus muting the impact of a lower P/E. For the Schiller Model to be correct, a macroeconomic catalyst is required to drive inflation and interest rates higher without a concurrent rise in real economic growth. Runaway deficit spending could be a catalyst, but time will tell.
Schiller Model Background
Robert Schiller is a Yale professor that made his name by publishing a book in the year 2000 titled "Irrational Exuberance". (This title stole the phrase from Alan Greenspan's infamous speech in 1996 where he declared "irrational exuberance has unduly escalated asset values.") In the book, Schiller made the case that the S&P 500 was exceedingly overvalued based on his "cyclically-adjusted price-to-earnings" ratio (or, "CAPE").
The CAPE ratio divides the current level of the S&P 500 by the inflation-adjusted average of the last 10 years of S&P 500 EPS ("Schiller EPS"), with the key assumption being the S&P 500's net profit margin is inherently cyclical and thus mean-reverting over time. In December of 1999 the CAPE ratio was 44 times. Assuming Schiller EPS would grow by the historical average nominal rate of 6% and that the CAPE ratio would revert to a terminal P/E of 17.5 times, the 10-year expected return for the S&P 500 was just 3% per annum at the time Schiller's book was published (this expected return framework is the "Schiller Model"). Schiller could not have timed it better. The S&P 500 soon entered a multi-year bear market, ultimately losing -1% per annum over the 10-year period from December 1999 to December 2009 - a "lost decade". The Schiller Model's preeminence had been cemented, becoming the expected return model of choice for "long-term" investors.
Dirty Little Secret
But the Schiller Model has a dirty little secret: it's a single-factor market timing tool that has undoubtedly cost investors more money than it's made them over time. As Peter Lynch famously said, "Far more money has been lost by investors preparing for corrections than has been lost in the corrections themselves."
Had Robert Schiller published his book in December 1997 when the CAPE ratio was at 33 times and the S&P 500 was expected to return 4% per annum over the next 10 years, he could have made almost the identical "irrational exuberance" claim he made in 2000. But from December 1997 to December 1999 (two red circles in the image below) the S&P 500 returned a cumulative 56%, and for the 10-year period ending in December 2007 the Index returned 5.9% per annum, almost 2% more than the projected return of 4%. (For a $1 million starting portfolio the difference of 5.9% versus 4% works out to almost $300,000 of ending portfolio value.)
A more recent example is the 10-year period ending the day of the COVID low, March 23, 2020. From March 23, 2010 to March 23, 2020 the S&P 500 returned 8.9% per annum. In March 2010 the Schiller Model projected a 10-year return of 8.6% per annum for the Index. Pretty darn accurate on paper. The problem is that it took a "100-year storm" to do it. Prior to the COVID crash, at its 2/19/20 peak the S&P 500 had returned 13.6% per annum since the March 23, 2010, well in excess of the projected 8.6%.
DEFICIT SPENDING
The resounding success of large-scale deficit spending jumpstarting the economy out of its COVID coma could act as a green light to policymakers to maintain outsized fiscal deficits long into the future. The potential consequences of runaway deficit spending, both good and bad, are vast, and investors need to keep an open mind.
Modern Monetary Theory (or, "MMT") is the theory that a government that issues debt in its own currency is only limited in its ability to spend by the level of inflation it is willing to tolerate, since it can always pay off its debt by printing more currency. Outside of Japan - which has aggressively deployed MMT policy to combat the deflationary impact of its population decline - developed economies have largely steered clear of MMT for fear of triggering Weimar Republic-like hyperinflation. But COVID might have changed the game. The lockdown used to combat the virus forced policymakers to spend whatever it took to plug the associated economic hole using a highly aggressive combination of fiscal and monetary stimulus (see image below). The good news is that it worked, getting the economy back on its feet in a matter of months. The potential bad news is also that it worked. Because the fiscal/monetary stimulus combination worked so well and, most importantly, hasn't yet triggered out-sized inflation expectations (5-year inflation expectations remain below 2%: see second image below), there is an excellent chance policymakers see a greenlight for maintaining outsized fiscal deficits long into the future.
The worst-case scenario for the stock market is stagflation, where inflation and interest rates rise without a concurrent jump in real economic growth. This scenario appears remote with inflation still stubbornly low - but it's possible, and would result in severe P/E multiple compression. The best-case scenario is a post-World War 2 redux. After more than a decade of weak economic growth in the wake of the Great Depression, large-scale fiscal deficit spending to fund the war worked to re-ignite the US economy, kicking off a multi-decade economic boom. A redux is not outside the realm of possibility: Sustained large-scale fiscal deficits paired with perhaps the greatest technology boom in world history could be a potent combination.
But if runaway deficit spending happens at all, the ultimate impact on the stock market will likely fall somewhere in the middle and happen over a very long period of time. For now, keeping an open mind is the most profitable action to take.


